
Introduction
Managing your product risks in Jira is great – you can use the flexibility of Jira to add various fields to the risk table, customise the risk table and the risk matrices and filter/sort the data any which way you want when using the SoftComply Risk Manager app on Jira.
But what if you’d like to report your risks in Confluence? That is especially important for all of those companies that may want to add risk matrices and risk table views to product risk reports, the templates for which you may already have created within Confluence.
We are happy to inform you that we have just released an extension to the SoftComply Risk Manager app on Jira Cloud: the SoftComply Risk Manager for Confluence! This is a free extension that displays the Risk Table and the Risk Matrix macros on your Confluence pages.
To check out all the features of the app, please see the User Guide of the SoftComply Risk Manager for Confluence.
You can also view a short video tutorial of the new Confluence app in our YouTube channel or try it out yourself – it’s free!
Below is a short step-by-step guide on how to get started with the new app. Note that you will have to use (or try out) the SoftComply Risk Manager on Jira Cloud beforehand.
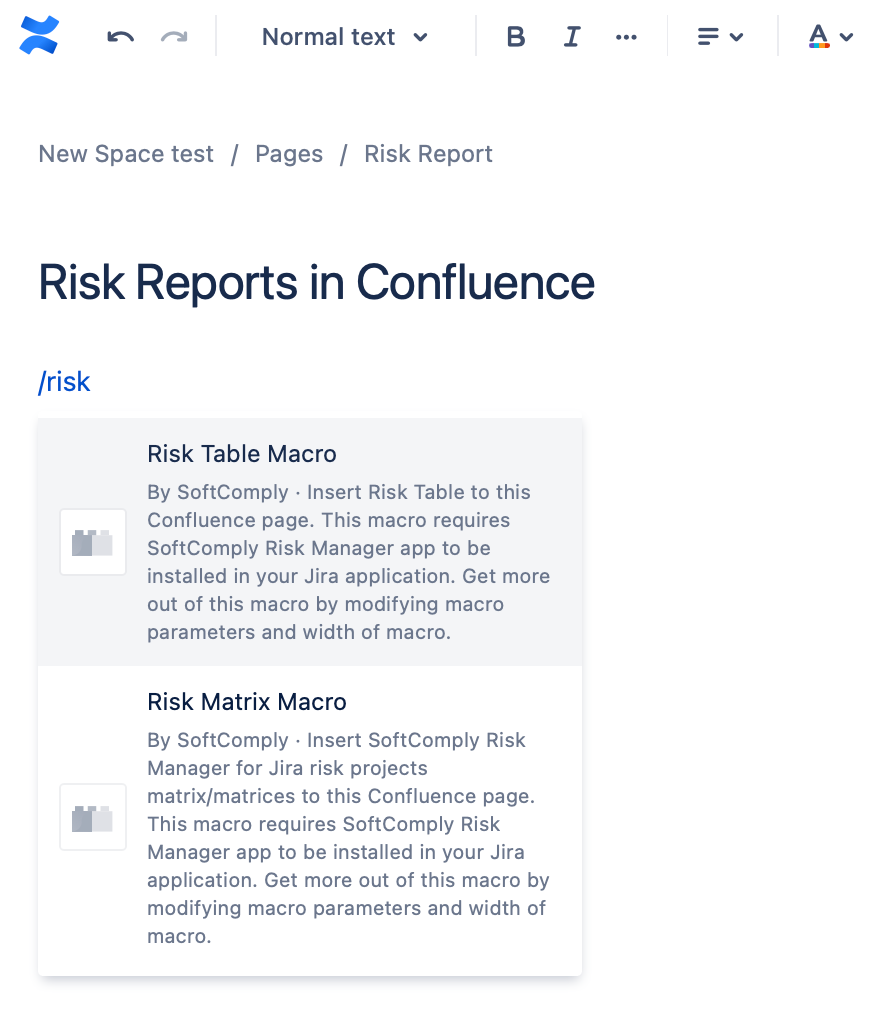
Step 1 – Add a Risk Macro on your Confluence page
After installing the free Confluence app, simply add a macro onto your Confluence page of either the Risk Matrix or the Risk Table, depending on the information you wish to display.
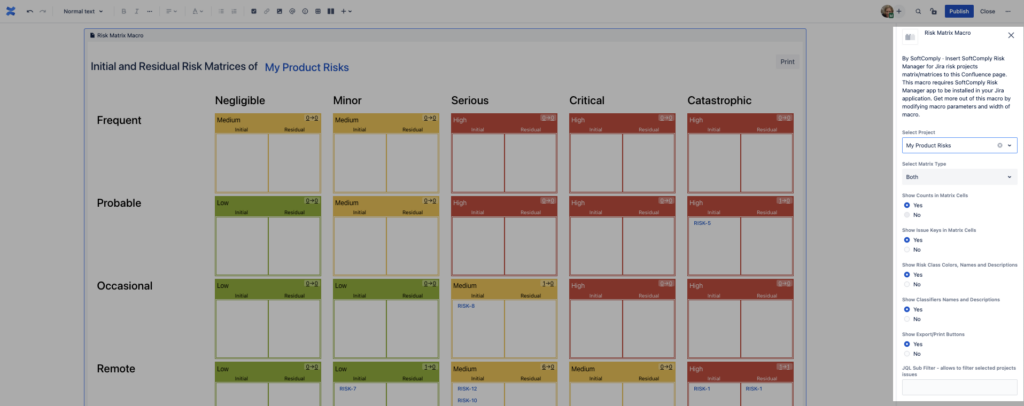
Step 2 – Configure the Macro
To customise the risk information to be displayed, please go to the Macro Settings to specify what and how you would like to see the information on the page.
For the Risk Matrix macro, you can choose the risk project from where the information is displayed, the matrices you would like to show (either Initial, Residual or both) and additional information about the risks like Risk ID numbers, names and descriptions of Risk Classes, Severity and Probability Levels.
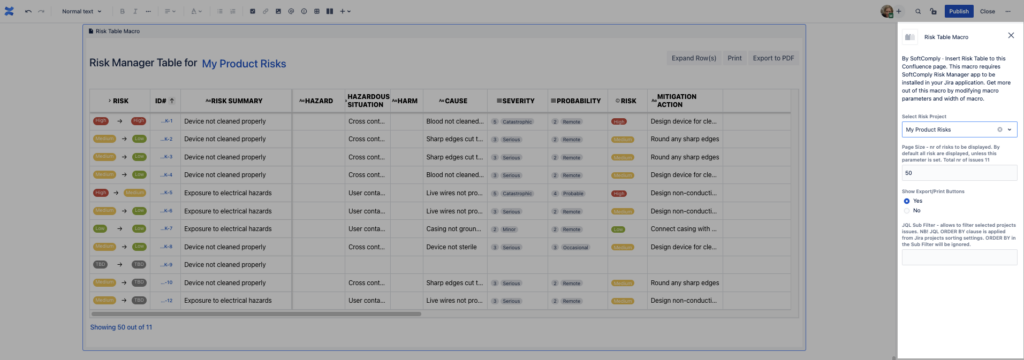
For the Risk Table macro, you can choose the risk project from where the information is displayed, the number of risks per page and in case you would like to display only a set of risks, the exact JQL Filter for it.
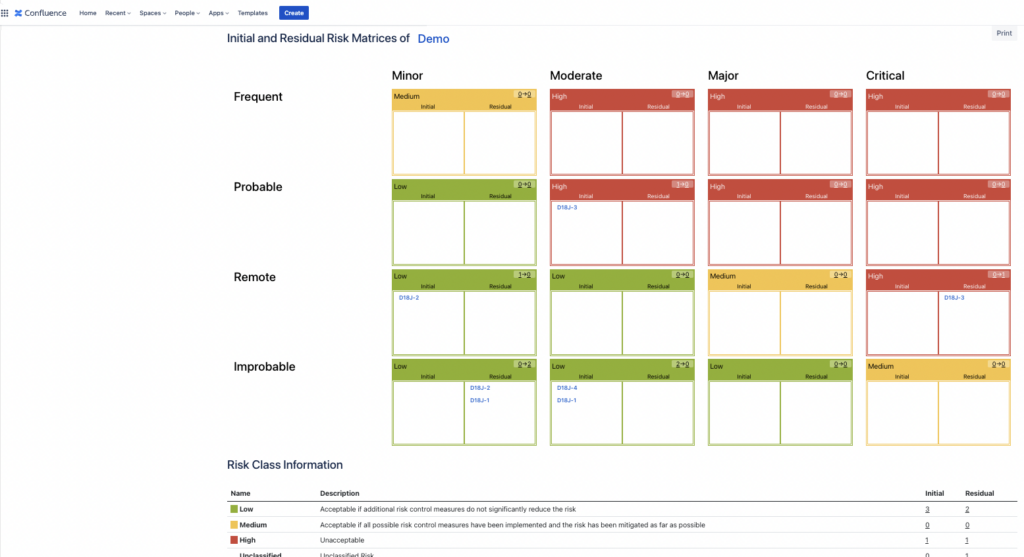
Step 3 – Customise your Risk Report on your Confluence Page
You can now have your Risk Matrices displayed on your Confluence page with all the details about the Risk Classes, Severity and Probability Levels. You can further customise the page for any type of report that you need.
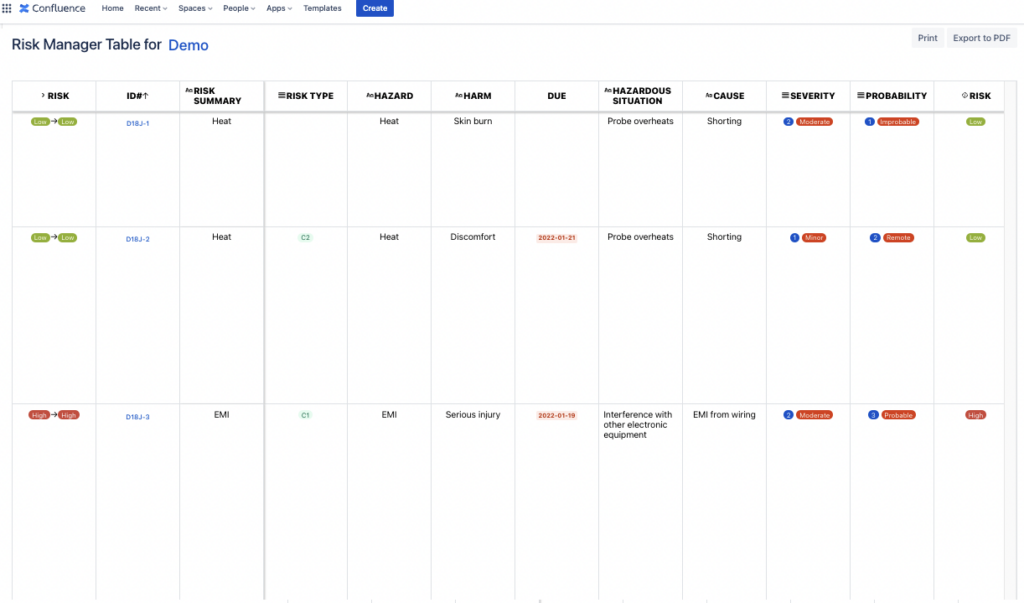
Now that you have your Risk Table on your Confluence page from the risk project of your choice, you can write the necessary text around it for reporting as needed.
To be able to easily navigate in the table, the Risk ID and Summary columns have been frozen when scrolling to the right.
Try out Risk Management in Jira Cloud & Reporting them easily in Confluence with Cloud:
For any questions or to arrange an online demo call, please contact us & we’d be happy to tell you more about these apps.


