SoftComply Risk Manager for Confluence is an extension of the SoftComply Risk Manager apps on Jira Cloud to visualize and report risks in Confluence.
With this app you are able to create Risk Reports in Confluence. You will be able to add the Risk Matrices, Risk Tables and Risk History graphs from Jira projects directly to your Confluence pages.
This is a free Confluence app – try it out yourself!
Quick Start Guide
This app works only in combination to the SoftComply Risk Manager apps in Jira. Please, see the specific sections in this user guide for different SoftComply Risk Management apps in Jira.
Create a Risk Management project in Jira using one of the SoftComply Risk Manager apps.
Next, install the SoftComply Risk Manager app for Confluence app from the Atlassian Marketplace to your Confluence instance. This step requires Confluence admin permission.
Add Risk Matrix, Risk Table or Risk History macro to the page and connect it to the specific project in Jira
Success! Now your Risk Reports from Jira will be always up to date and ready to share in Confluence, as well.
1. Risk Matrix Report in Confluence
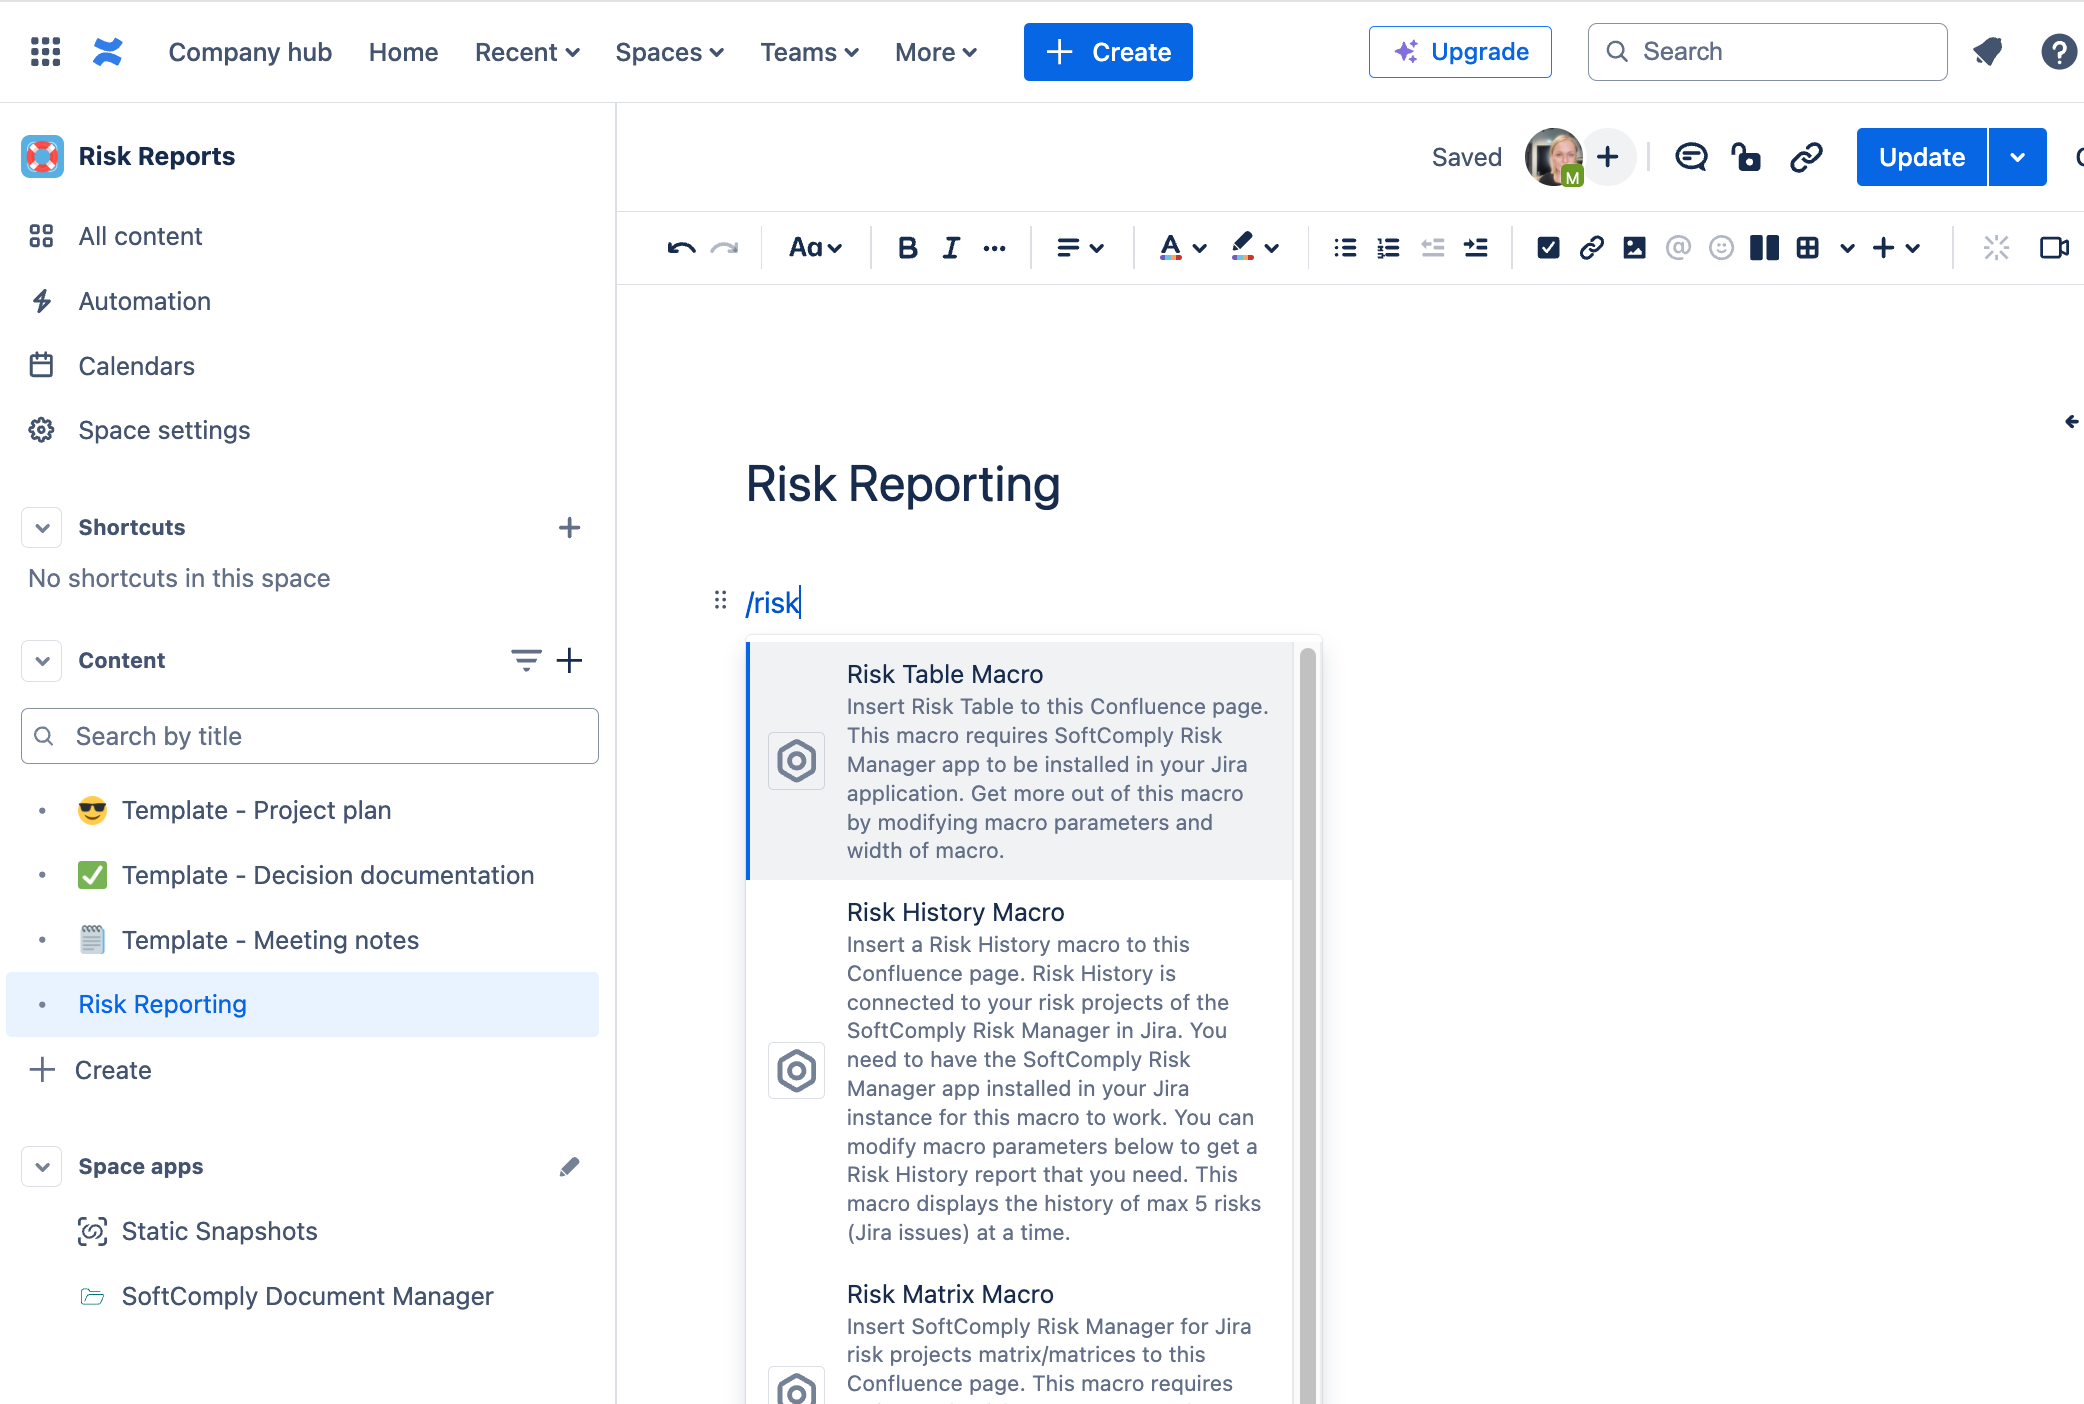
Create or start editing a Confluence page and insert the macro by typing /risk on the page. You will be provided with these options: Risk Matrix Macro, Risk Table Macro and Risk History Macro.
Select Risk Matrix Macro and start connecting it to a specific Jira Risk Project by clicking on the pen sign below the macro:
Define the project and the Risk Model you wish to see on this page in the configuration panel.
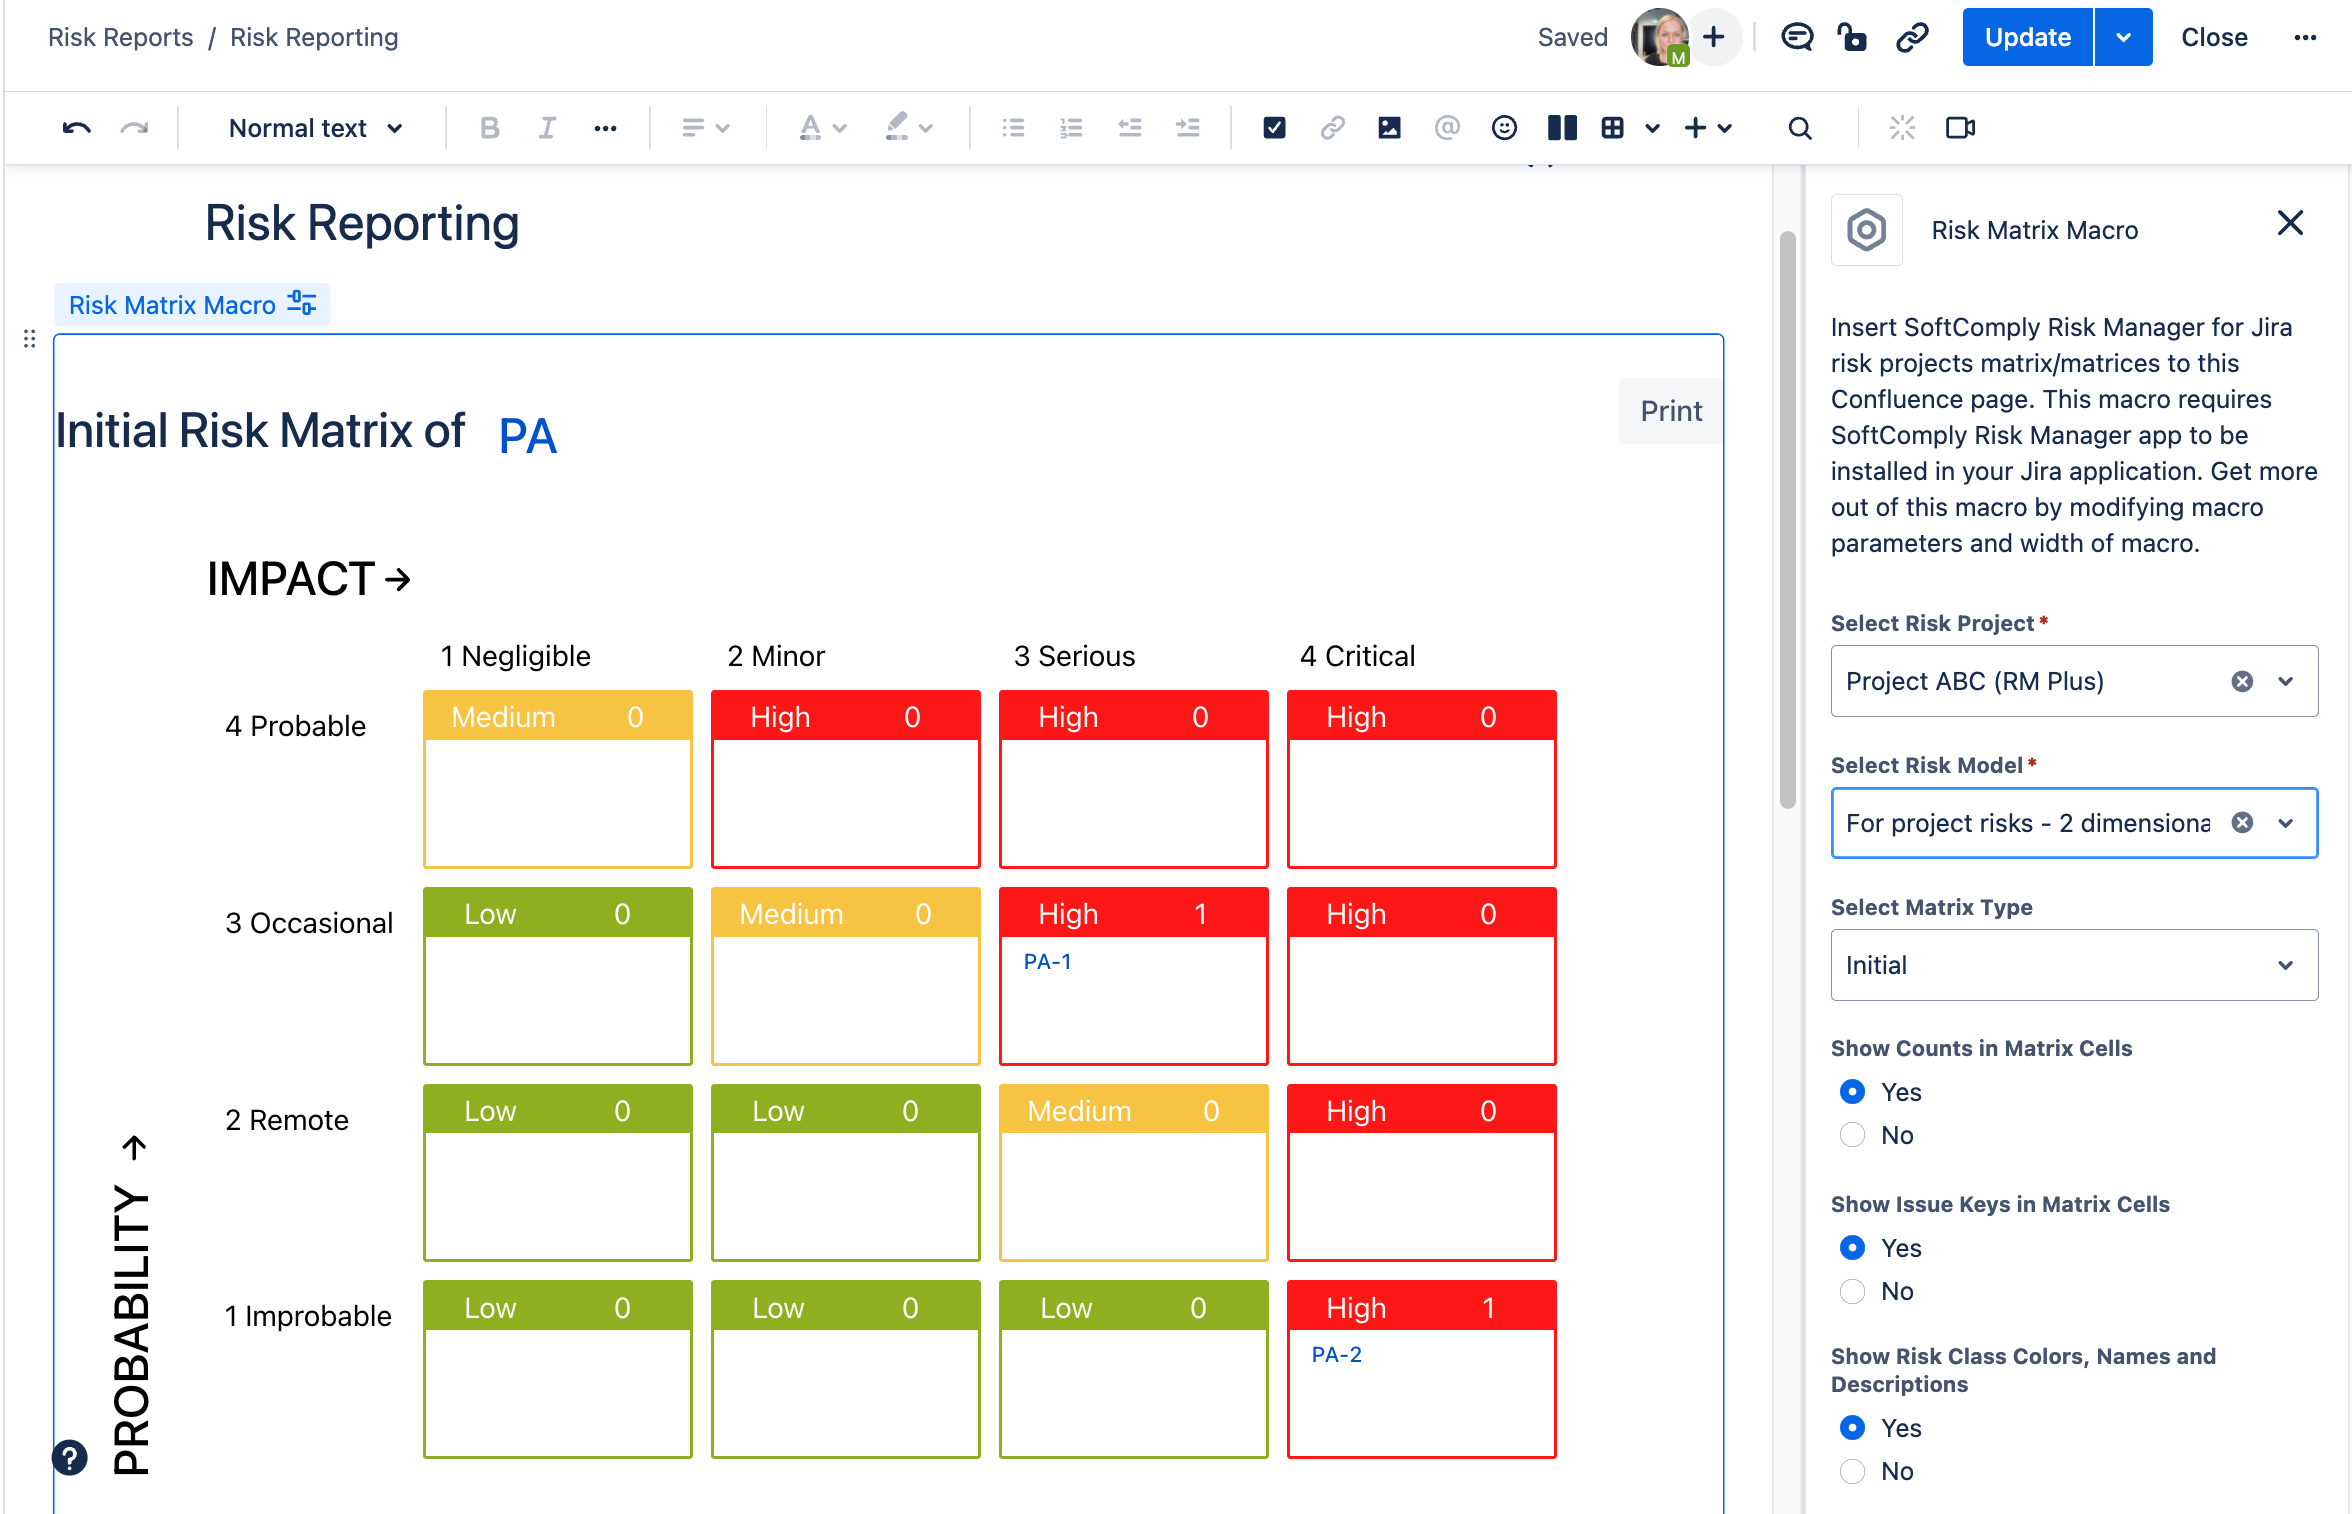
Note, that you can also use the options to include or exclude specific elements to be displayed on the final report.
You can also apply a JQL sub filter if you wish to display not all but only a specifically defined Risks in that project.
2. Risk Table Report in Confluence
Similarly to the Risk Matrix macro, start typing /risk on a page in Confluence and select the Risk Table Macro and connect it to the project in Jira.
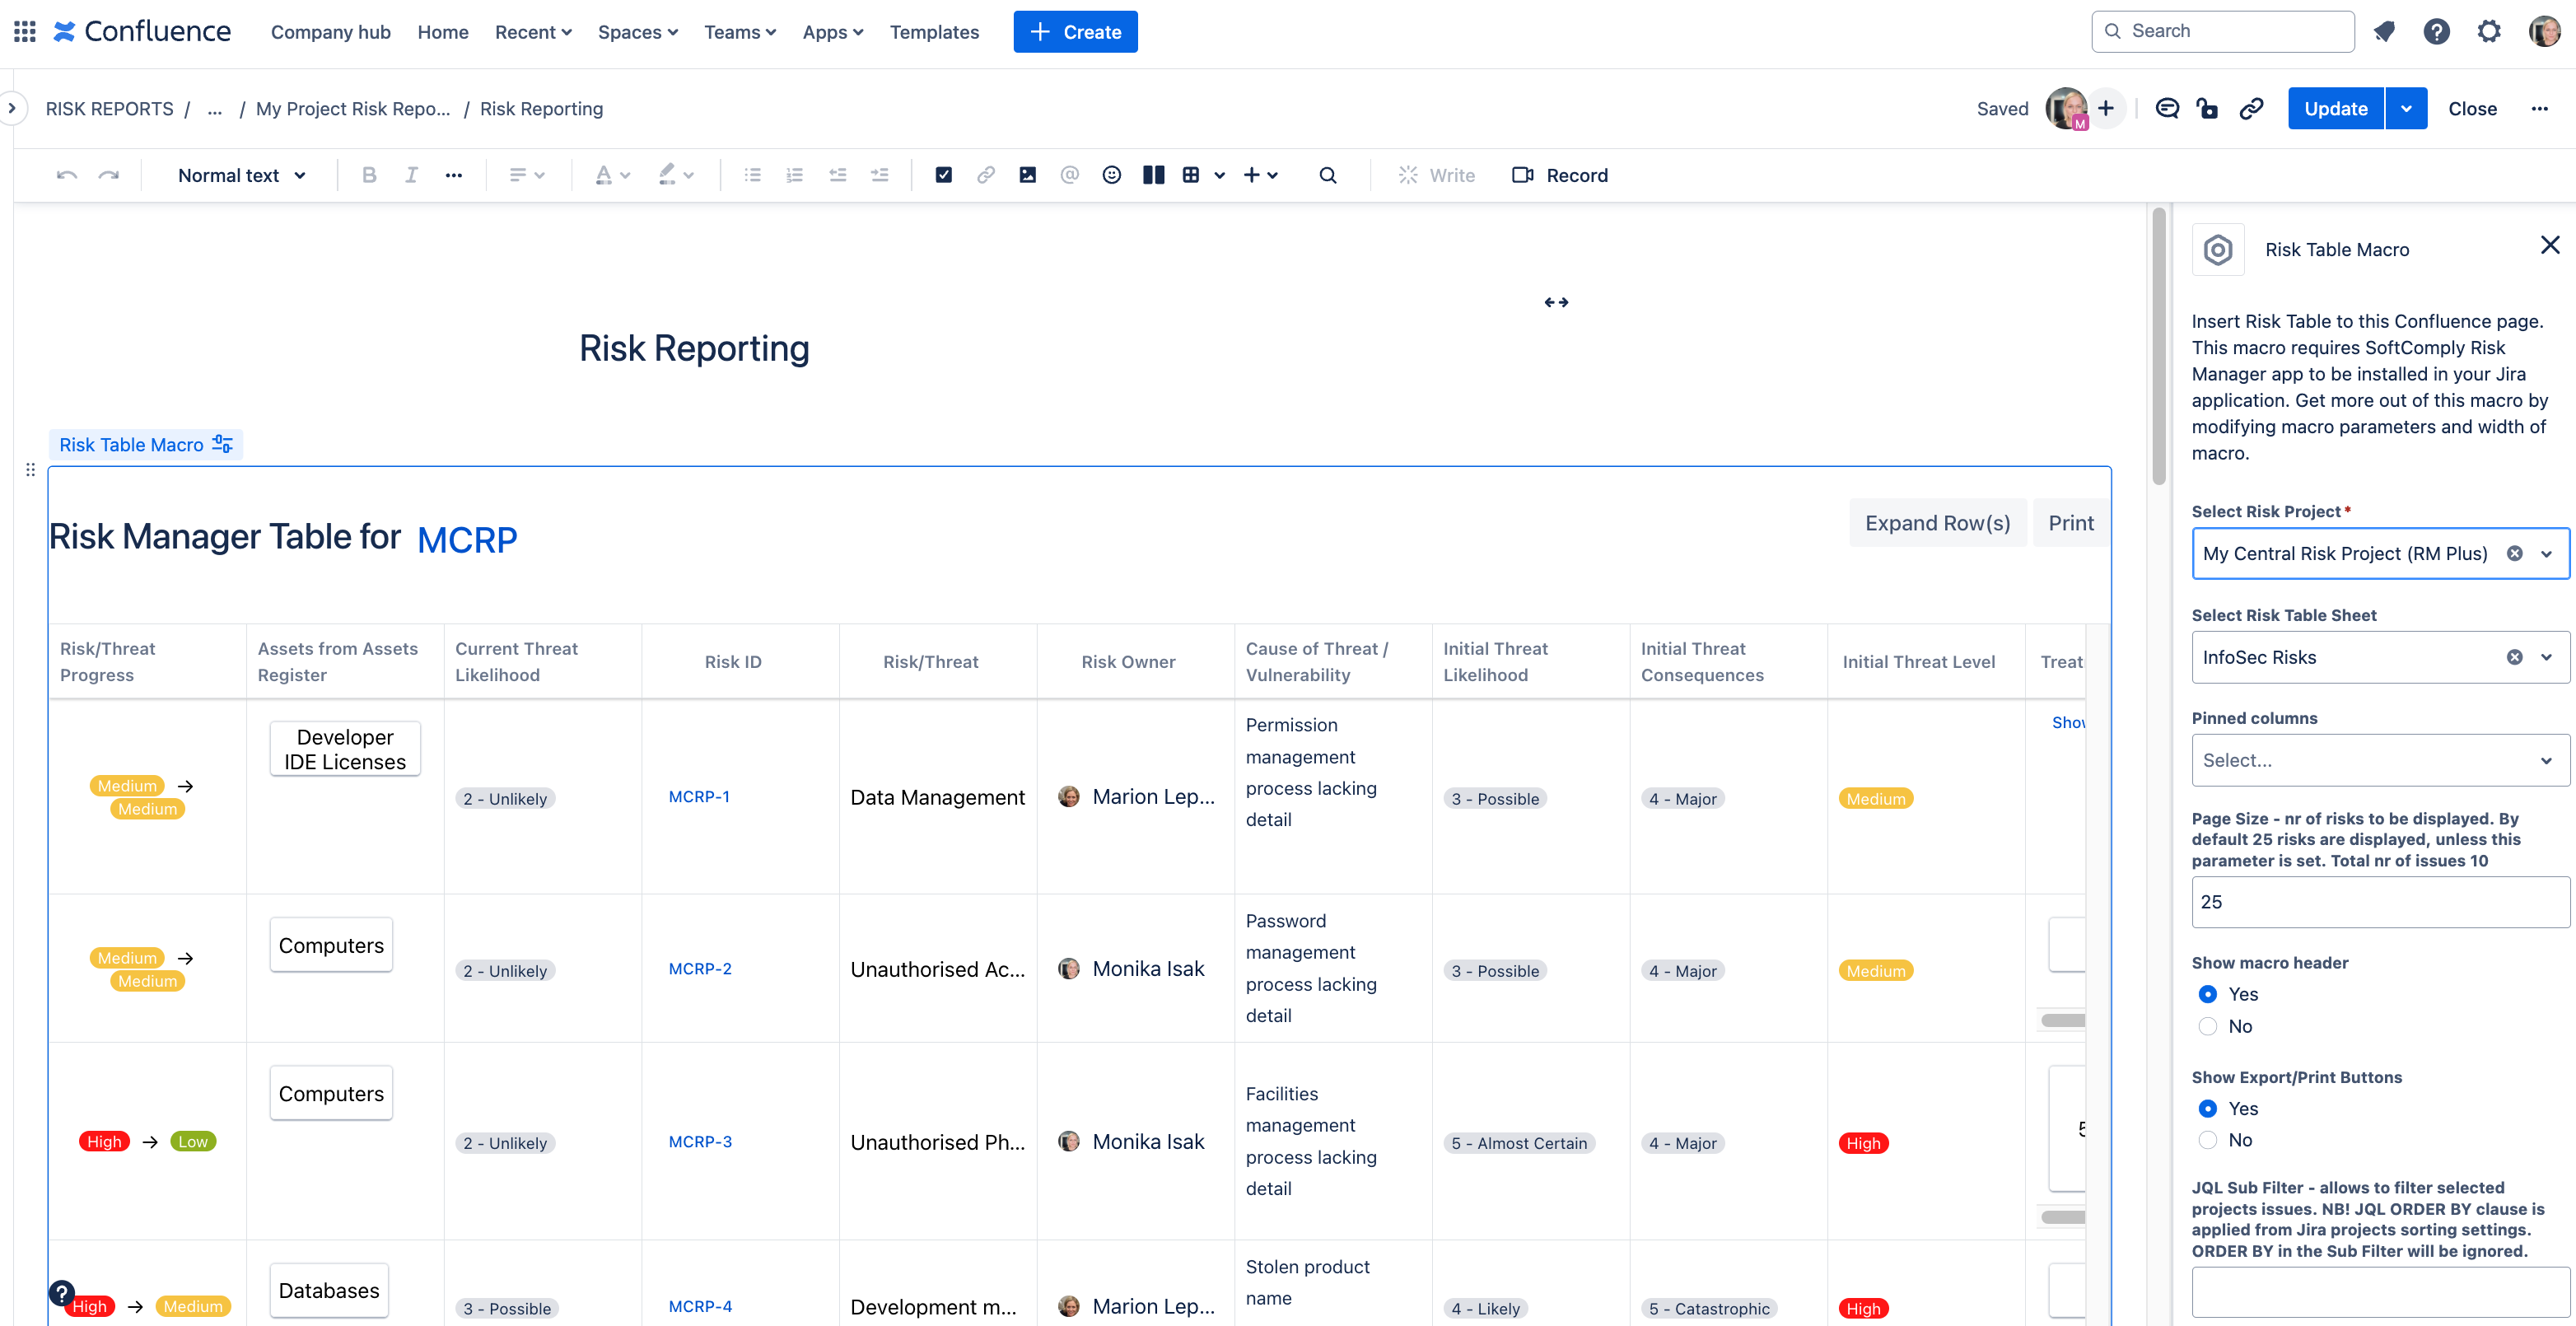
Note, that you will see results only once you have assessed at least one Risk using the Risk Management.
Once you publish the page, you can sort per column content and make the columns wider or narrower to better display the content. The changes made in Confluence, will not impact your project in Jira. To make changes to the content, you need to make the changes inside the Jira project.
3. Risk History Report in Confluence
This macro is available only for the SoftComply Risk Manager Plus and SoftComply Information Security Risk Manager users on Jira Cloud.
These Risk Manager apps in Jira capture all the changes to the Risk Values for each of the Risks. Using that information, you can visualize the Risk History over time on your Confluence page.
To display this graph, use the Risk History Macro and define the specific Risks (up to 5). Remember, the History will only be presented on a graph, once there has been changes to the Risk Values.
4. How to Connect Risk Reporting for Risk Manager Plus & Information Security Risk Manager
These powerful risk management apps on Jira need a dedicated integration to be established first. You will need Jira Administration rights to do that.
1. Navigate to Apps > Risk Manager (Plus) > Settings > Integrations > Confluence and create a token.
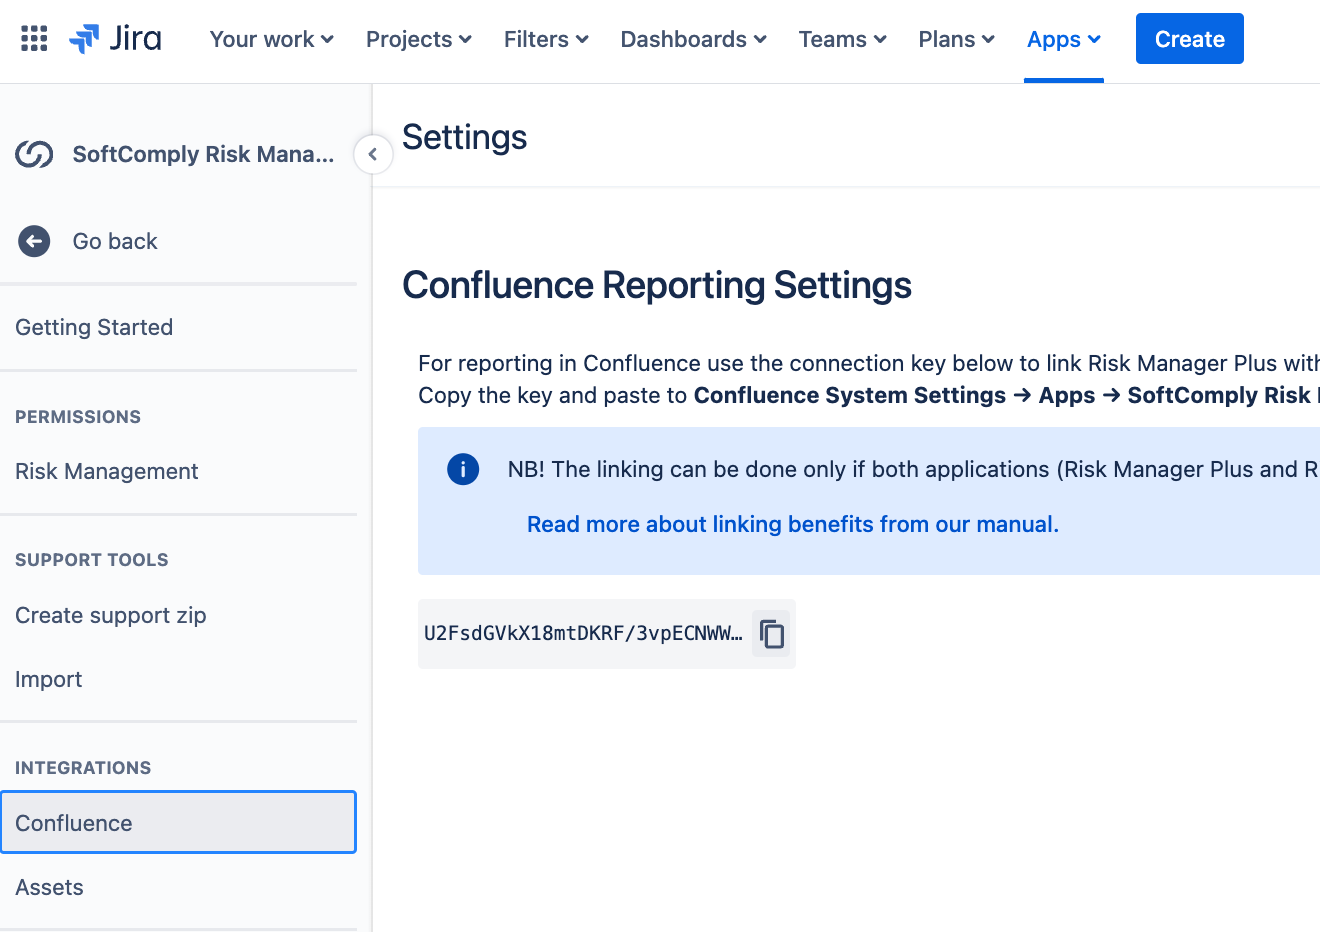
2. Copy the key and paste it to Systems Settings > Apps > Risk Manager (Plus).
With that the connection is established and you can bring your Risk Reports to a Confluence by following the descriptions above.