

Do you want to make your medical device risk management more precise? While many companies stick with single probability values in their hazard analysis, ISO 14971 suggests breaking down probability into P1 and P2 components. I’ll show you exactly how to set this up in Jira using nested risk models.
Watch the video above to see the P1 and P2 setup process in Jira in action.
What P1 and P2 Decomposition Actually Means
The ISO 14971 standard suggests splitting the probability of harm into two distinct parts:
- P1: Probability of a hazardous situation occurring
- P2: Probability of harm occurring from that hazardous situation
Your overall probability becomes P1 × P2. This isn’t mandatory (plenty of companies use single probability values just fine), but it offers two major advantages that make it worth considering.
Why P1 and P2 Makes Your Risk Estimates More Accurate
Advantage #1: Technical vs Clinical Expertise Separation
Here’s where this approach really shines. P1 deals with device failures and use errors – stuff your engineers know inside and out. They can give you solid estimates on component failure rates, software bugs, or user interface problems.
P2 focuses on clinical impact – what happens to the patient when exposed to a hazard. Your clinical specialists understand this territory. They know how patients respond to different types of exposure and can estimate harm probabilities based on medical evidence.
You don’t want your developers guessing about clinical outcomes, and you definitely don’t want clinicians trying to estimate circuit board failure rates. This separation improves accuracy by letting each expert focus on their domain.
Advantage #2: Targeted Risk Control Allocation
Different types of controls affect P1 and P2 differently:
- Design controls (redundant systems, fail-safes, better components) primarily reduce P1
- Protective measures (warnings, training, protective equipment) mainly reduce P2
This clarity helps you choose the right mitigation strategy and track which controls actually work.
Setting Up Nested Risk Models in Jira
I’ll walk you through creating nested risk models in SoftComply Risk Manager Plus. This feature lets you build a child risk model for your Probability calculation with P1 and P2 that feeds into your main hazard analysis risk matrix.
Creating the Child Risk Model (P1 and P2 Calculation)
Start in the risk model view within the SoftComply Risk Manager Plus app. You’ll find a P1 and P2 example template that uses a nested risk model setup.
Alternatively, you can build your own nested risk models from scratch by enabling the toggle underneath the risk model types for “use this risk model as input for another risk model”.
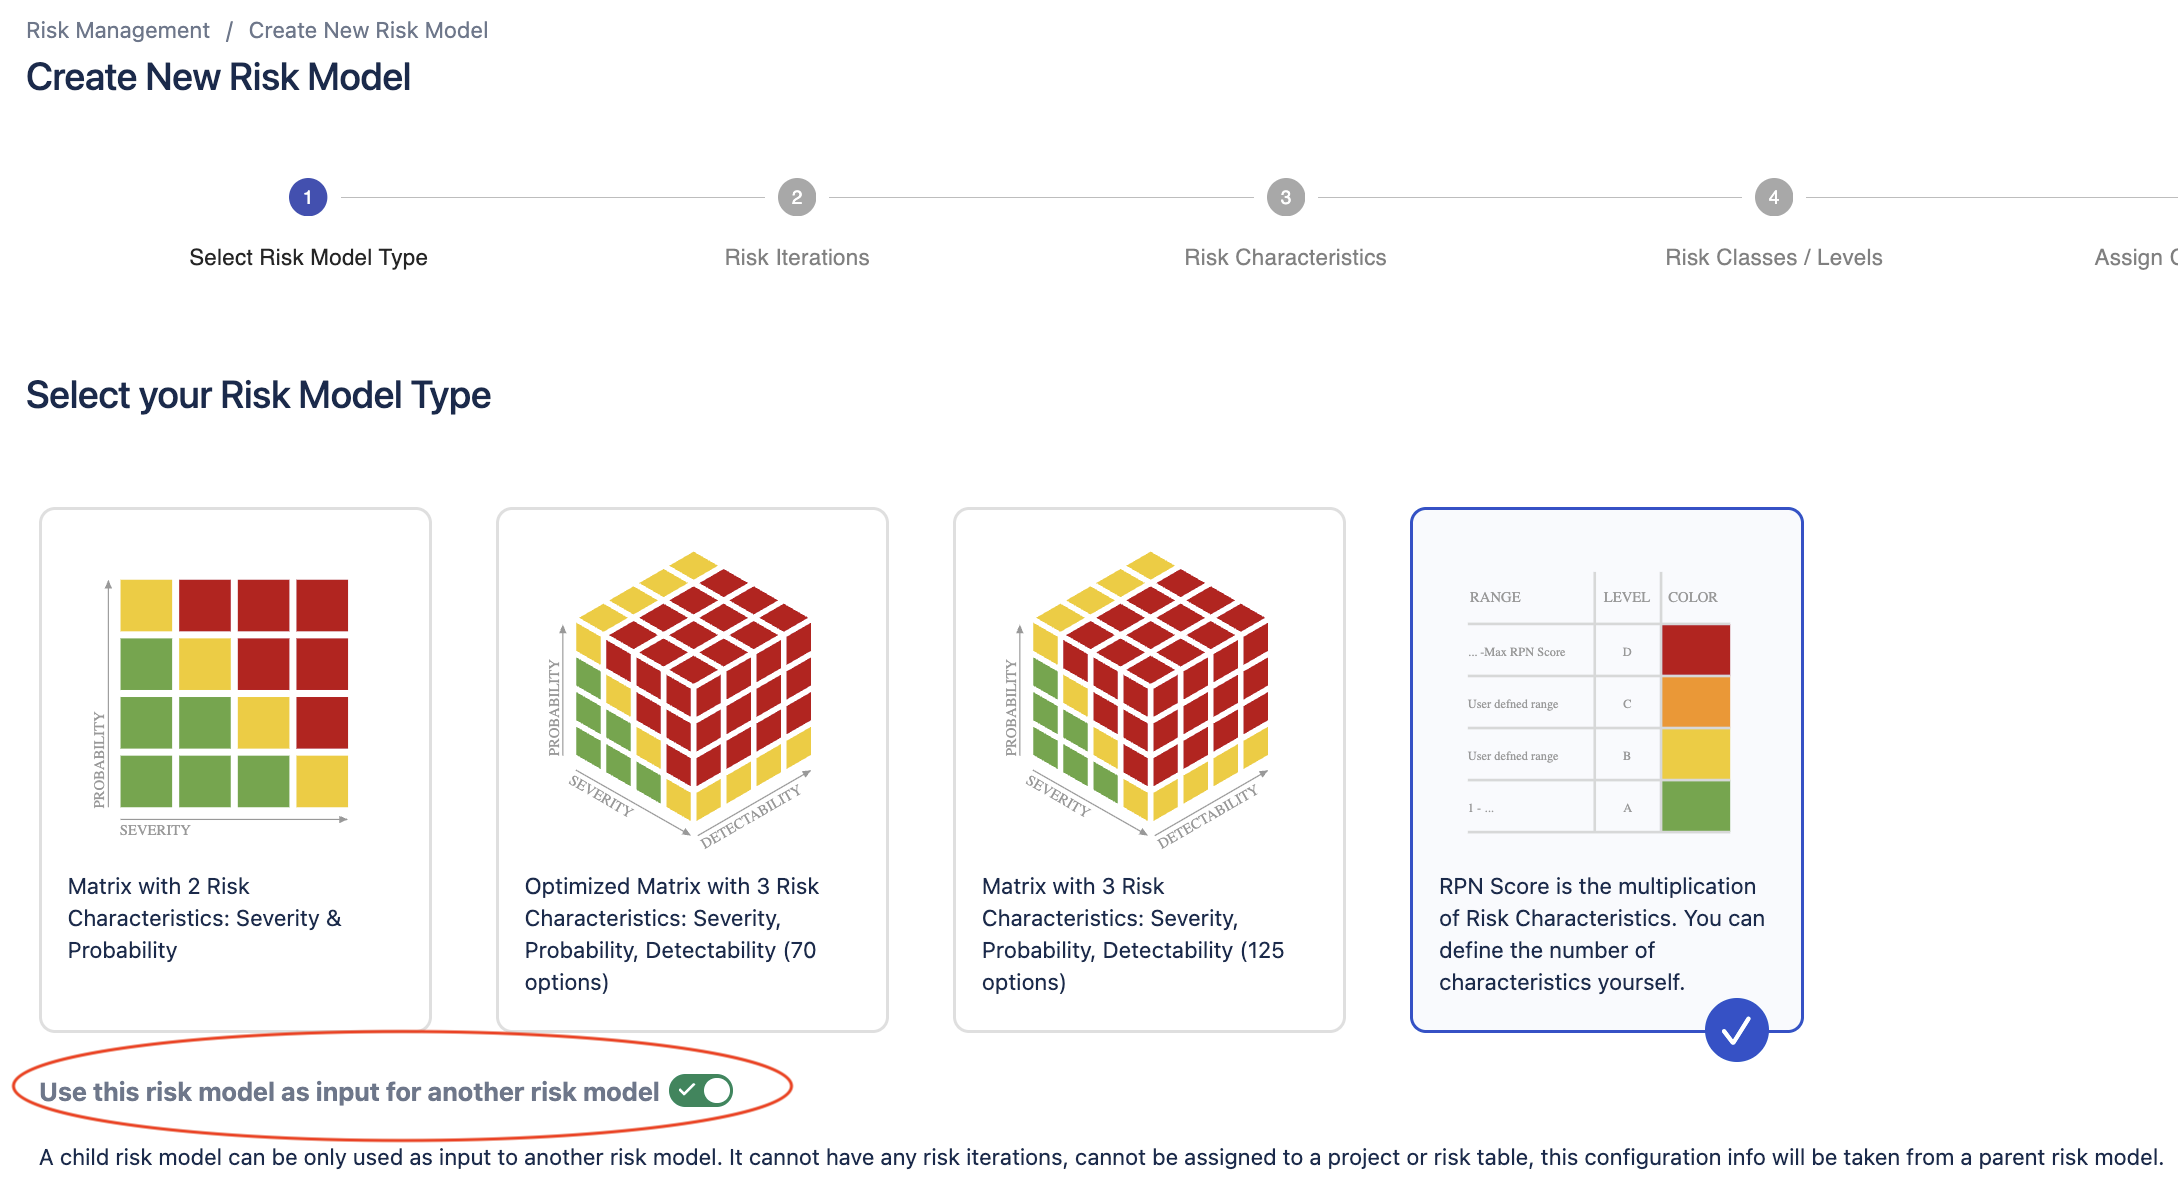
In our example, the child model is a risk score-based model with two probability characteristics:
- Probability of hazardous situation (P1)
- Probability of harm (P2)
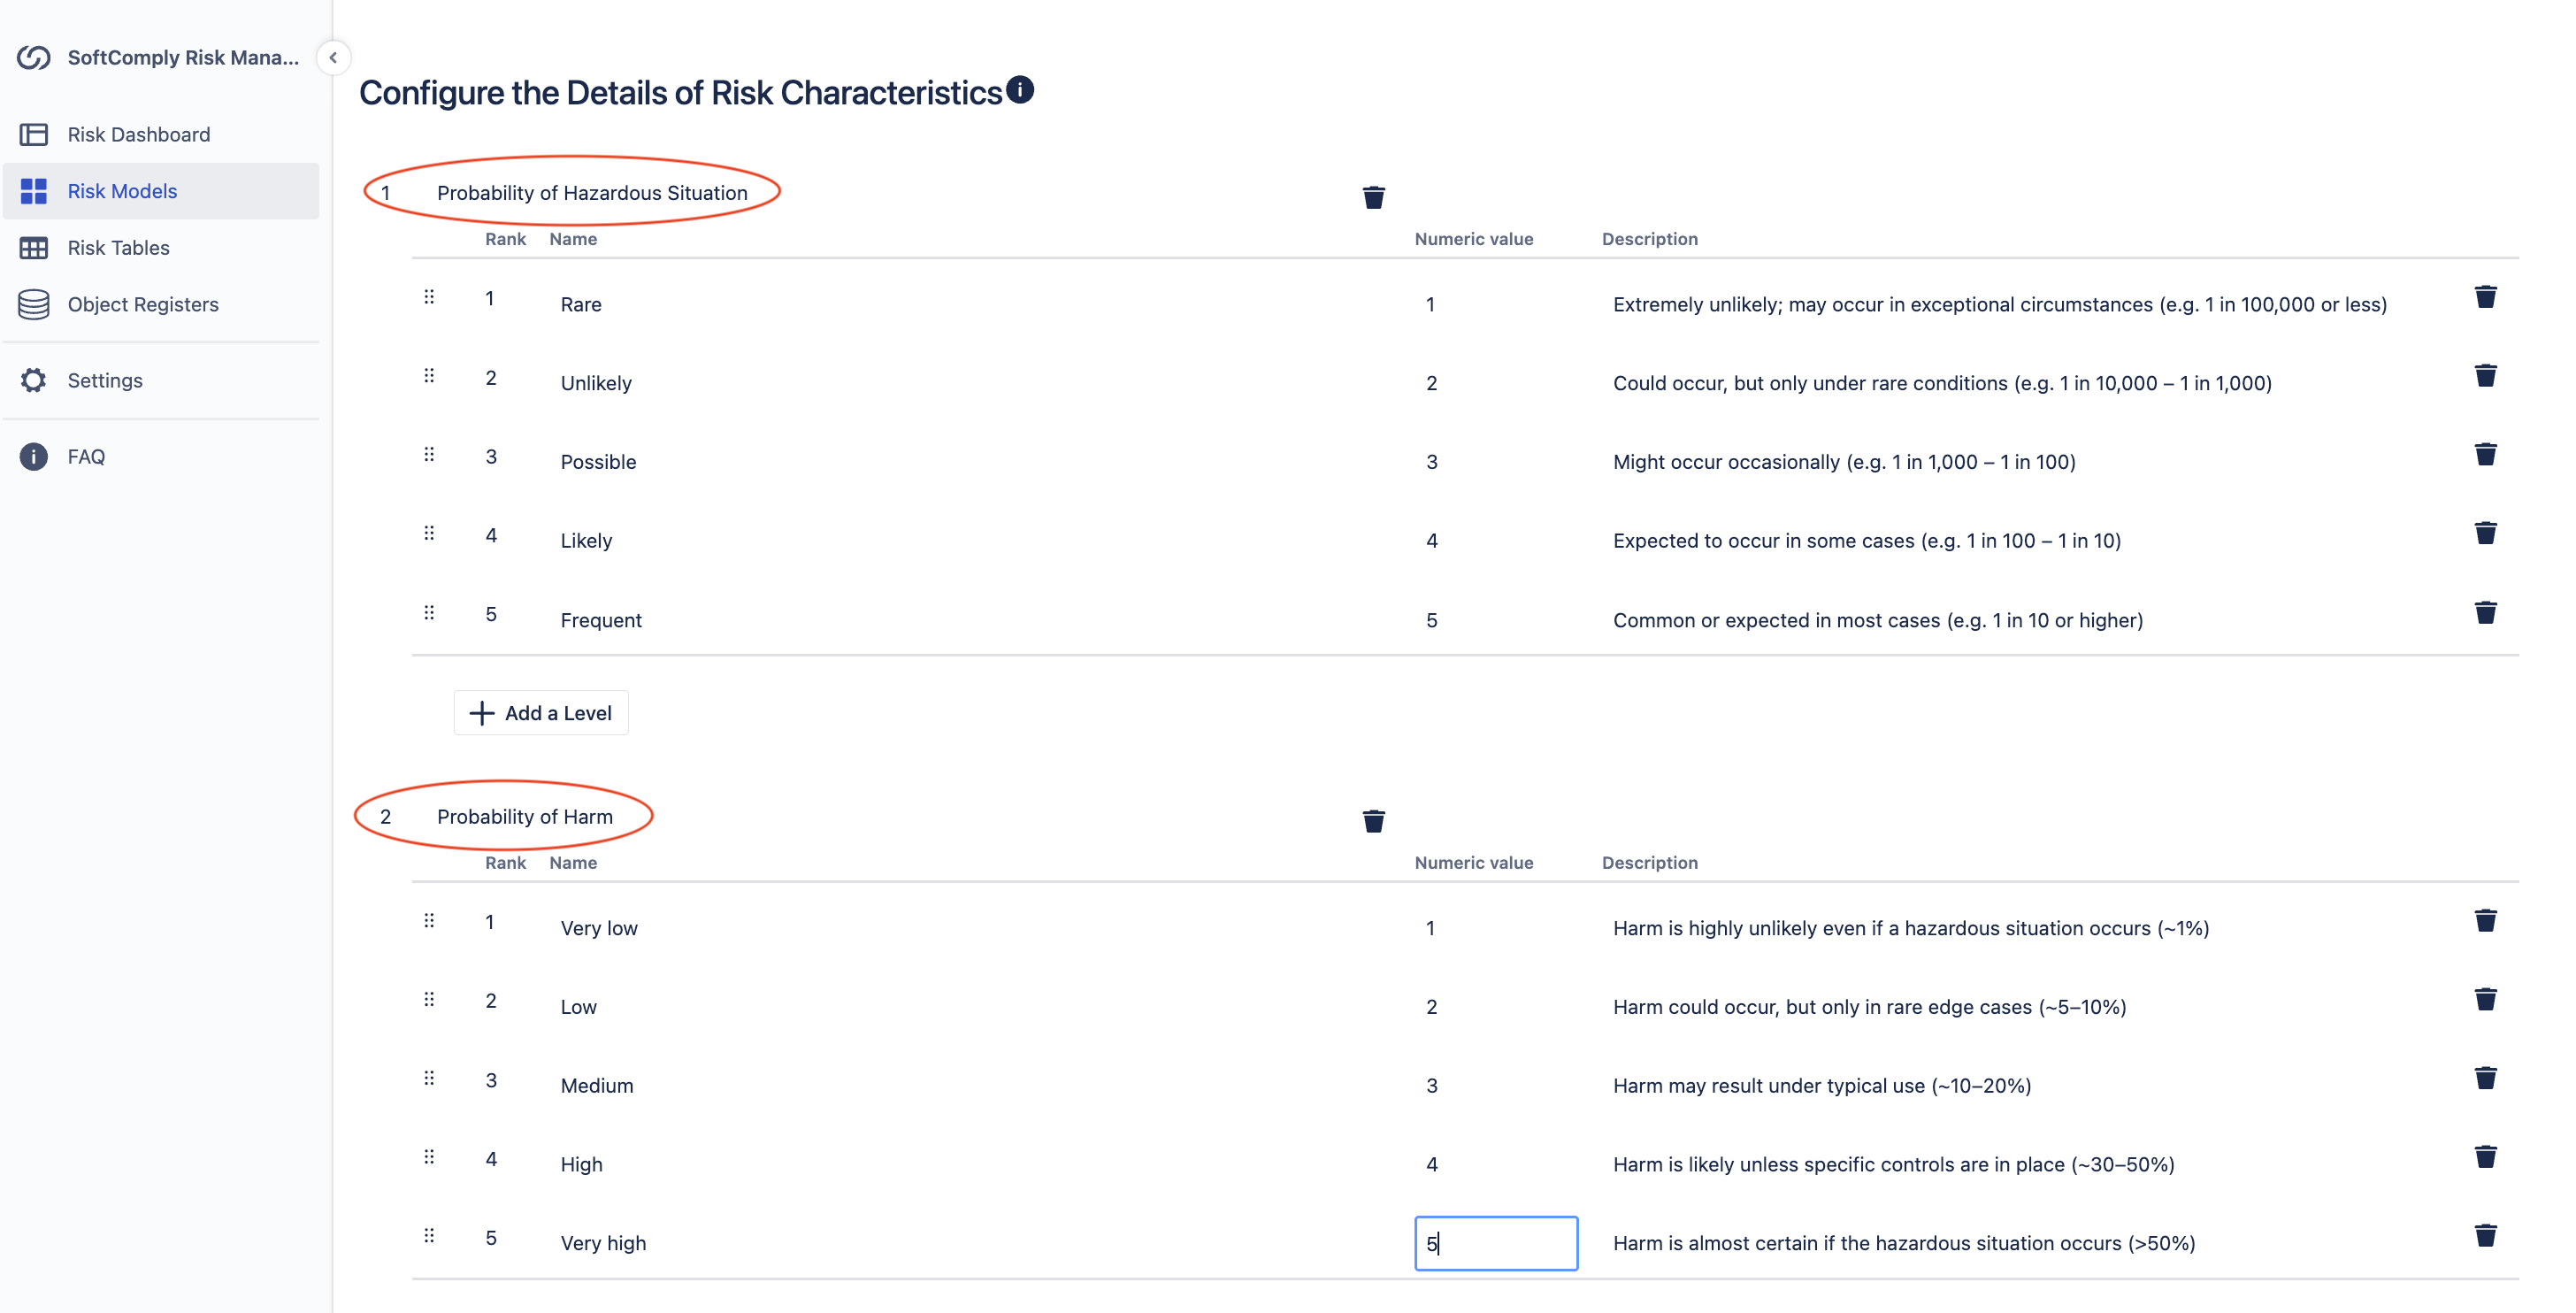
Define your probability levels and set up risk classes for your overall probability calculation. Name this model, e.g. “Probability Overall” and confirm it as your child model.
Building the Parent Risk Model (Main Hazard Analysis)
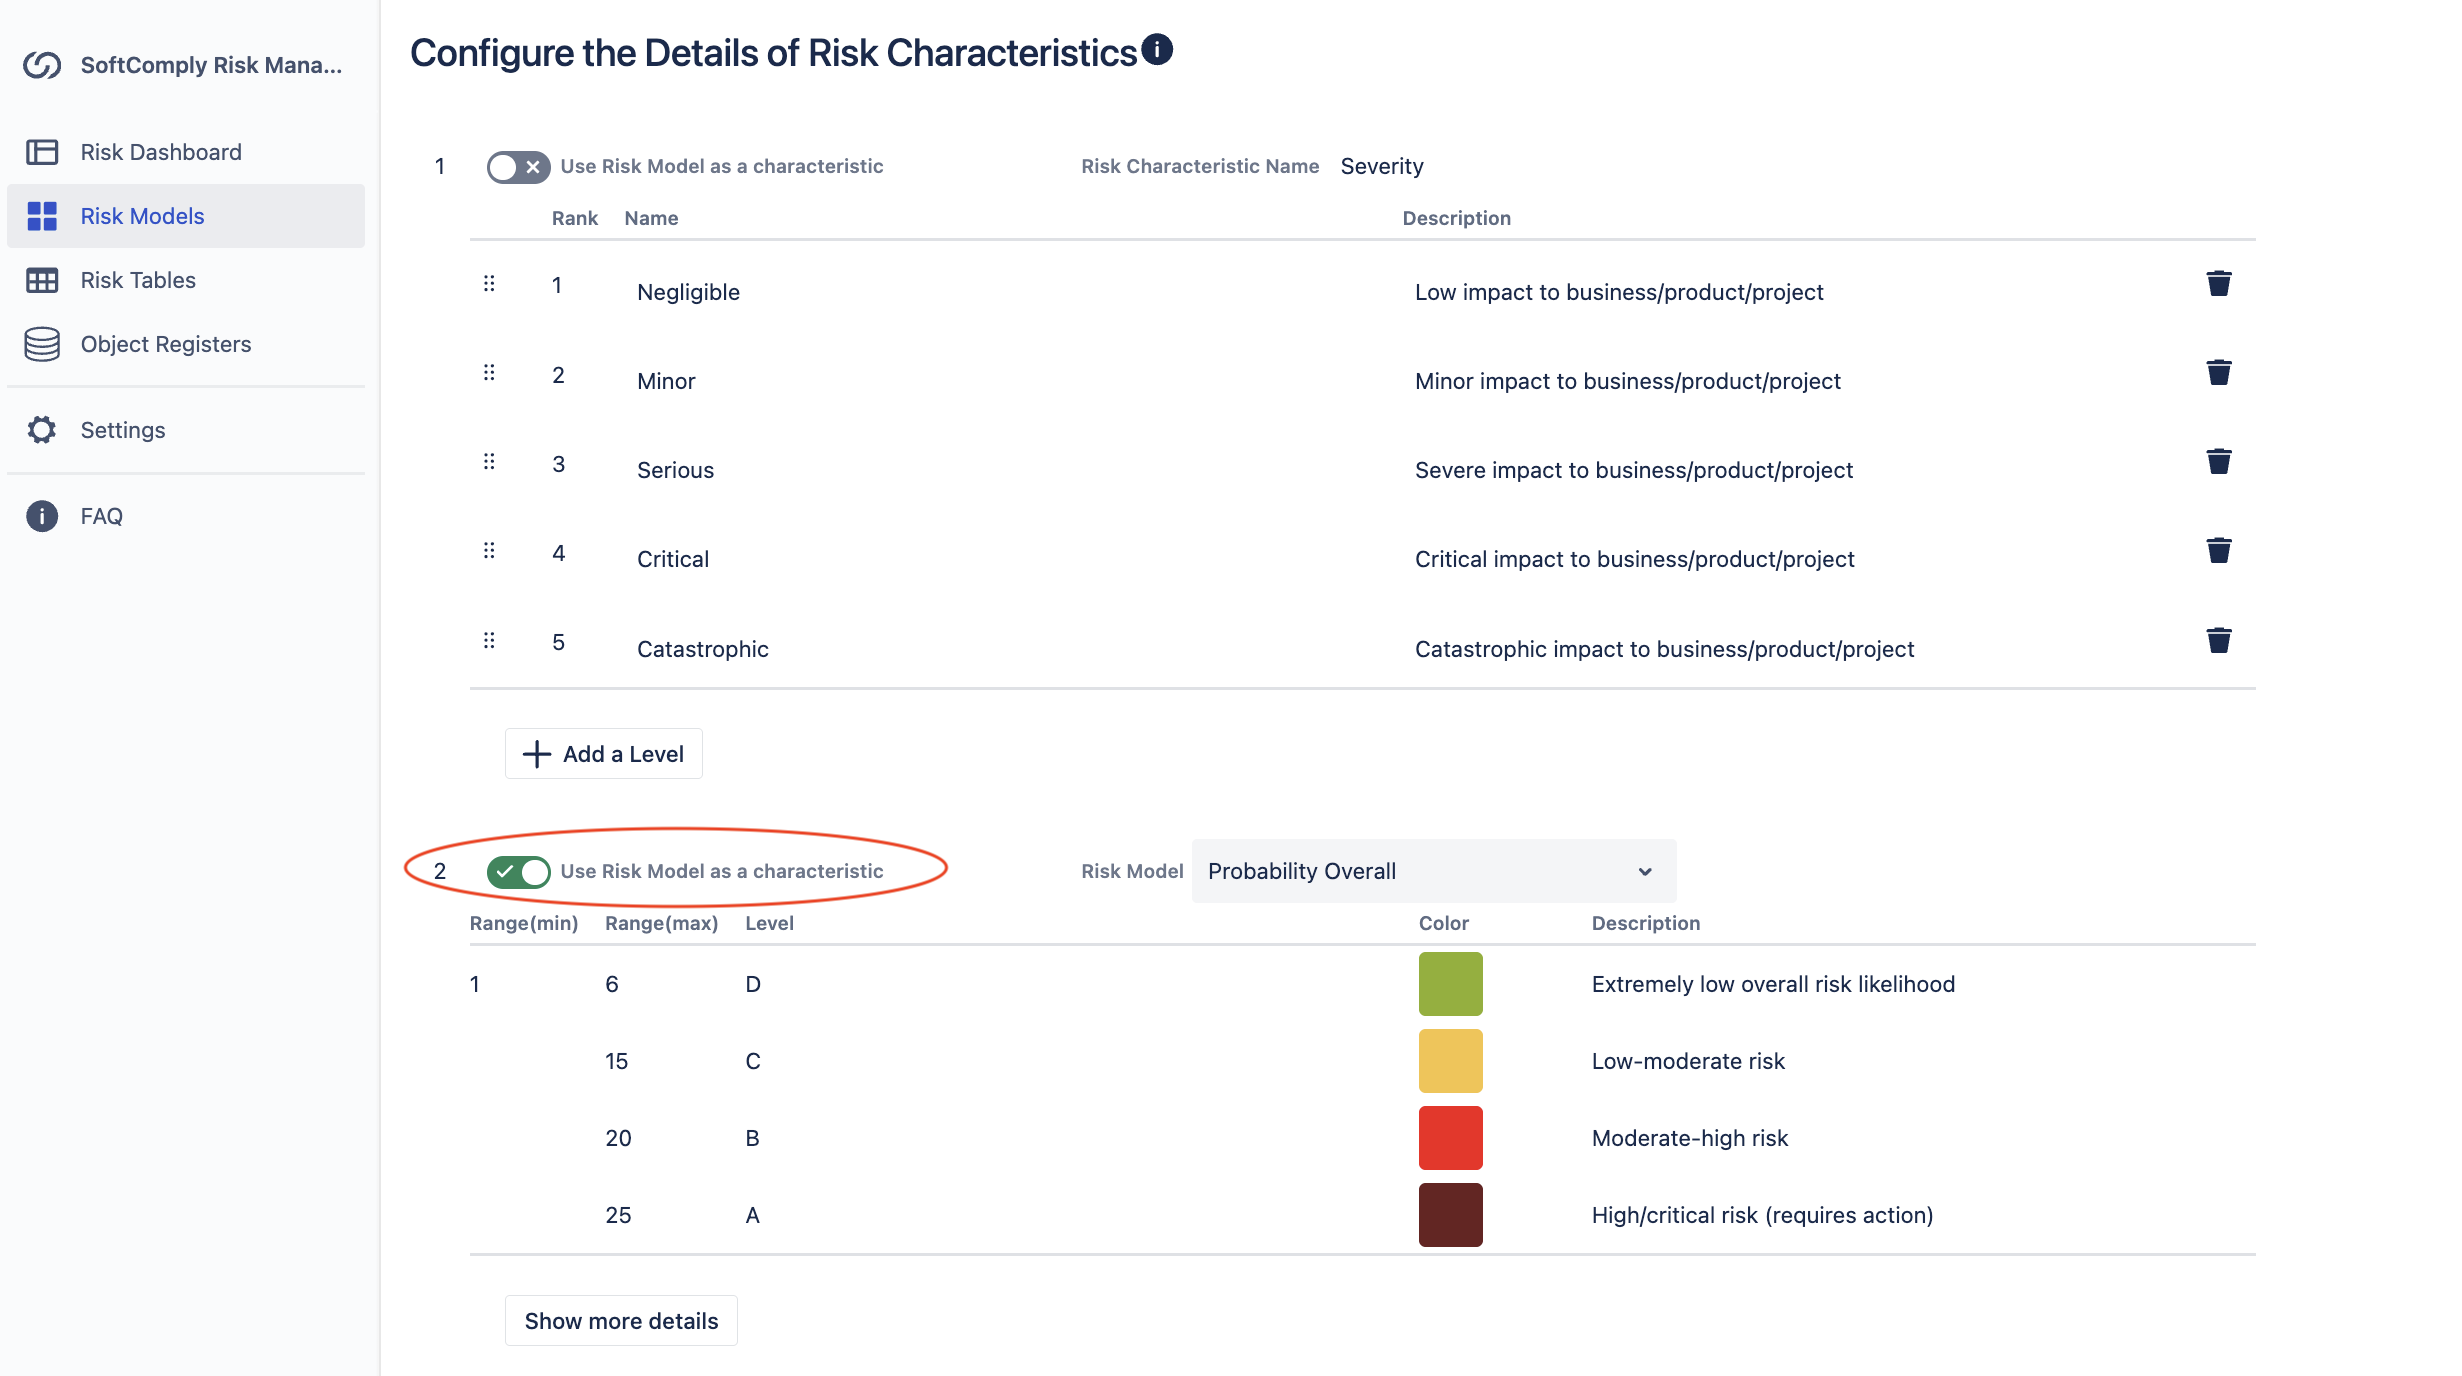
The parent risk model in our example is the classic 2D matrix:
- Y-axis: Severity (e.g. negligible to catastrophic)
- X-axis: Probability (coming from your child model “Probability”)
Set up your iterations (initial assessment, residual assessment, potentially post-market assessment). Define your severity levels and risk classes, then link the probability characteristic to your “Probability Overall” child model by enabling the toggle of “Use Risk Model as a characteristic” as highlighted below.
Assigning to Your Project
Once both risk models models are configured, assign the parent model to your Jira project.
Now you can start conducting hazard analysis in Jira using the P1 and P2 approach.
Real Example: Diabetes Management App
Let’s see how this works with a concrete example. We have a smartphone app that displays glucose readings from a connected glucose meter and helps users make insulin dosing decisions.
Example Hazard: User sees incorrect glucose data
Example Hazardous Situation: User makes wrong clinical decision based on bad data
Example Harm: Hospitalization due to hypo or hyperglycemia
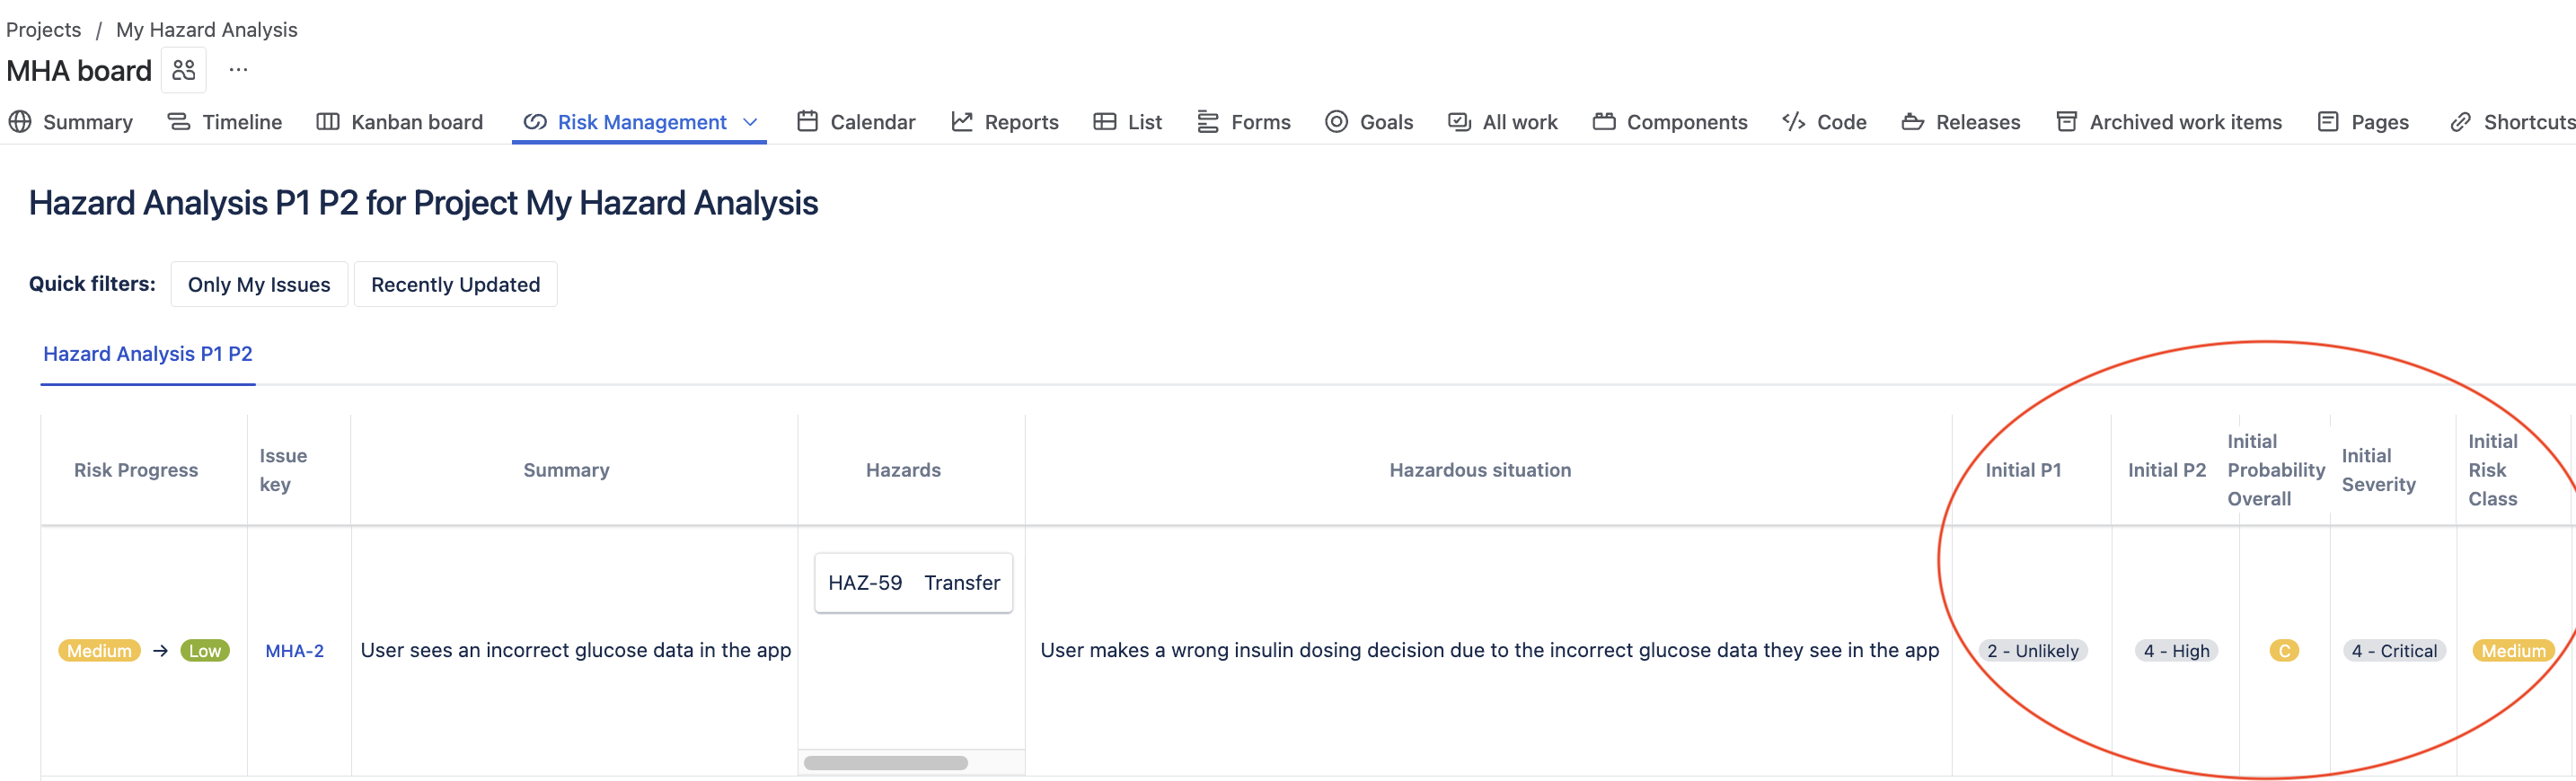
Initial Risk Assessment
P1 (Initial): Data corruption probability = 1 in 1,000 readings (unlikely)
P2 (Initial): Patient administers wrong insulin dose due to seeing wrong data = 1 in 5 cases (20% – quite high)
Overall Probability: Medium-high (level C in our model)
Severity: Very high (wrong insulin dosing can cause hospitalization)
Initial Risk Level: Medium
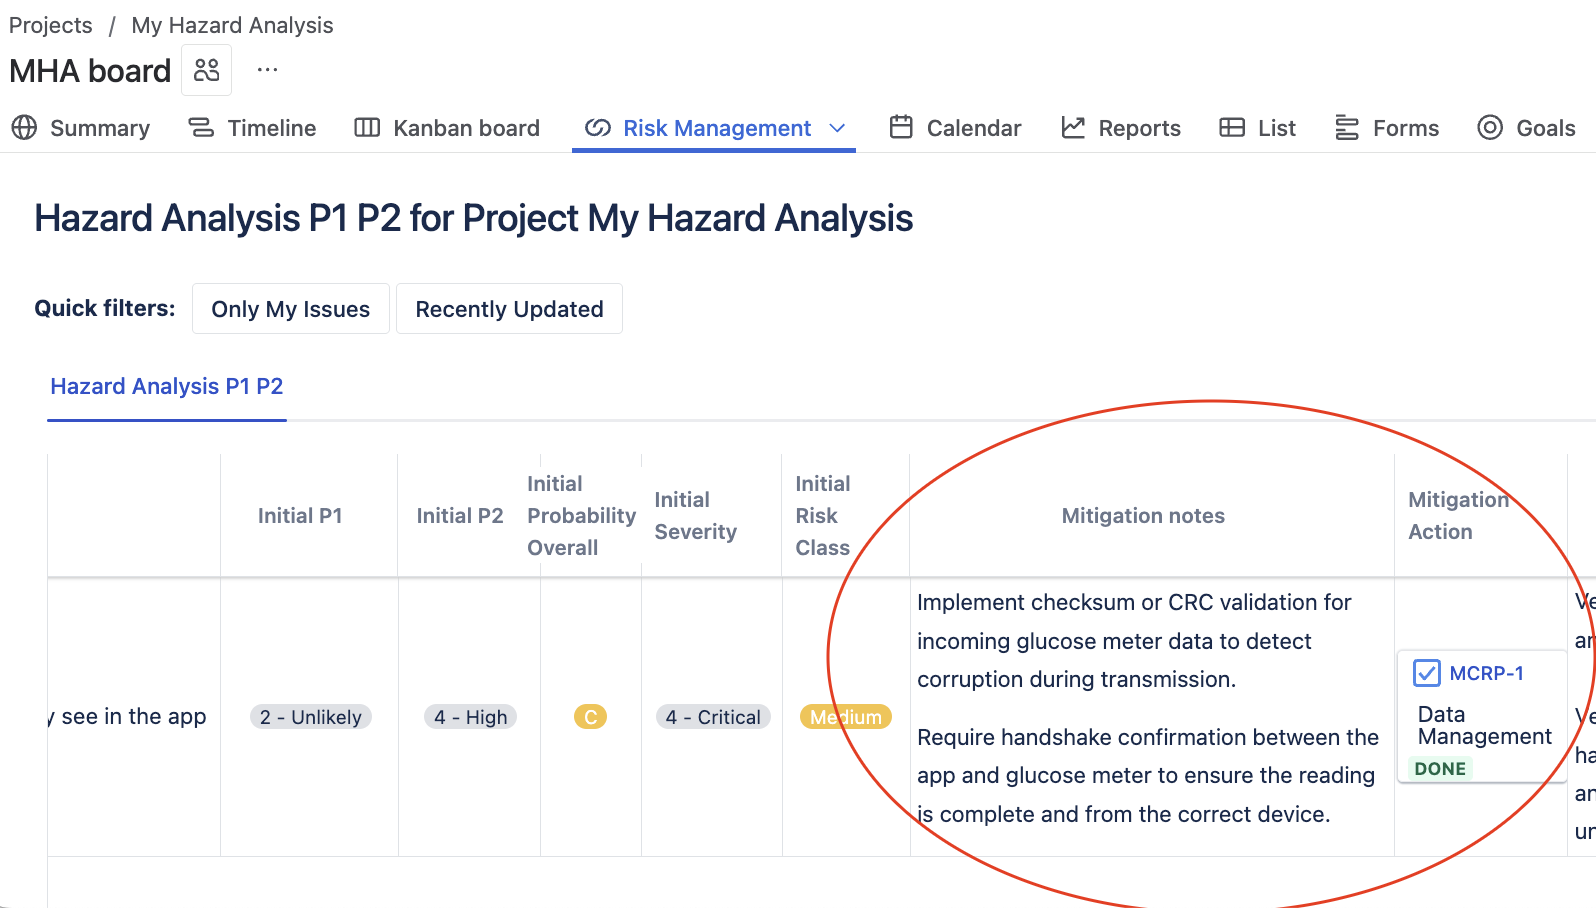
Mitigation Actions
We implement technical controls that lower P1:
- Checksums to validate incoming glucose data
- Handshake verification between app and meter
- Rejection of data from unpaired devices
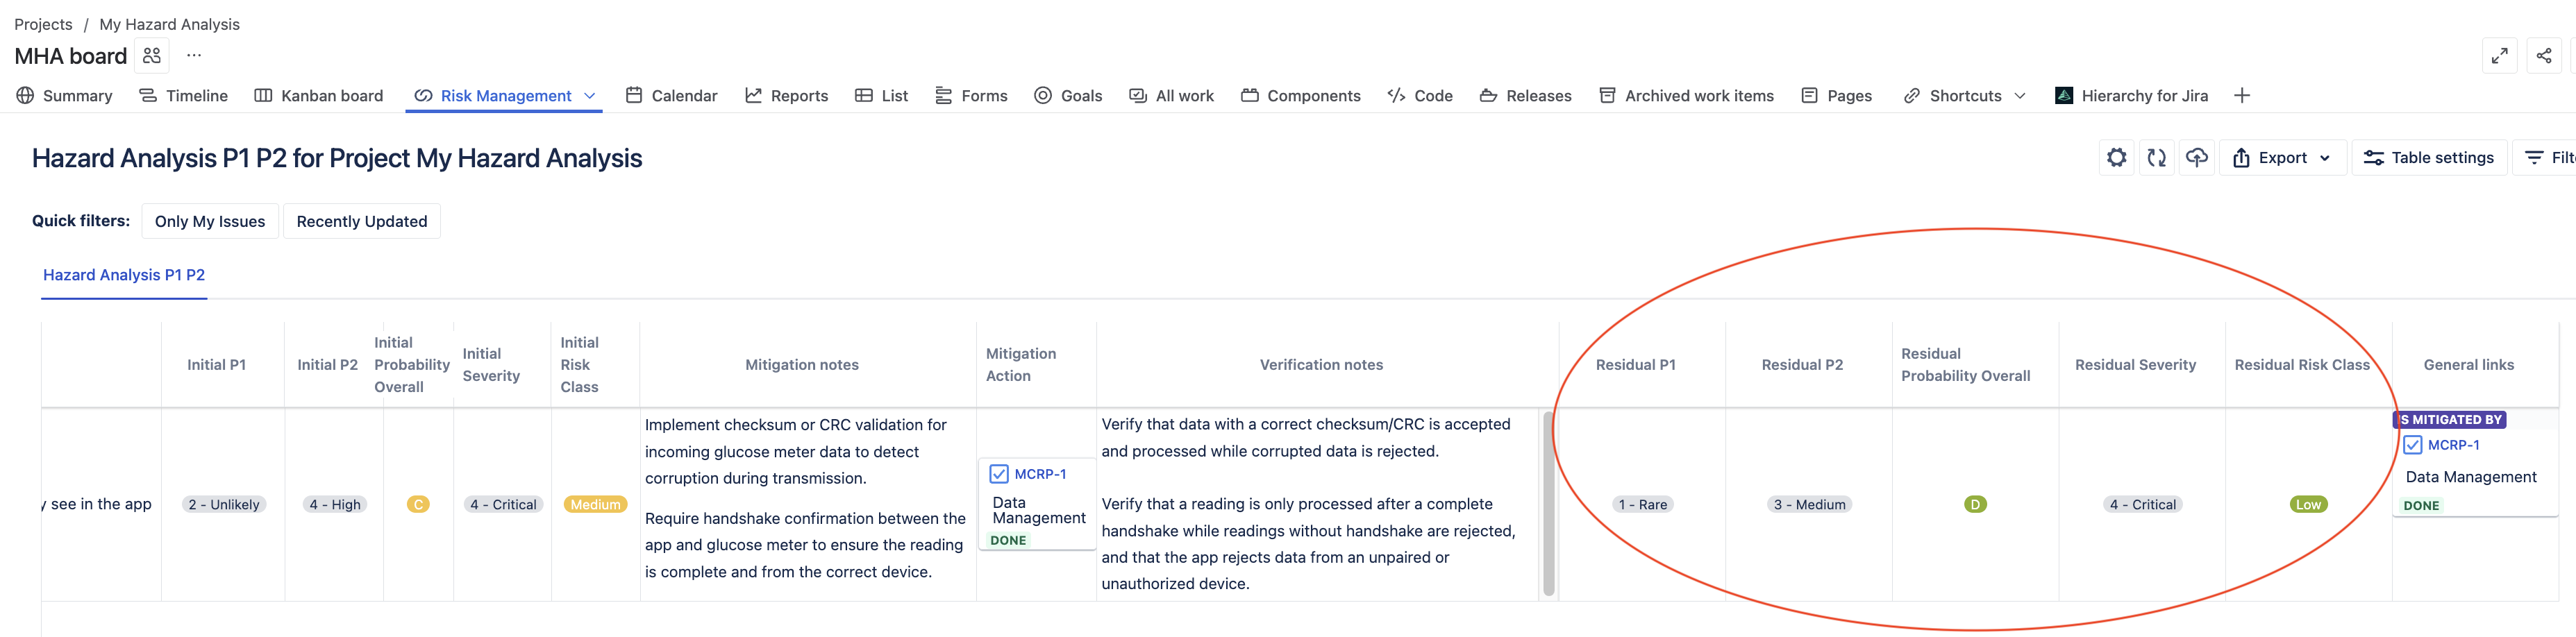
Residual Risk Assessment
P1 (Residual): Rare (mitigation significantly reduced technical failure probability)
P2 (Residual): Same as initial (if the situation occurs, clinical impact remains the same)
Residual Risk Level: Low (acceptable)
Notice how our technical controls reduced P1 but didn’t change P2. To reduce P2, we’d need different controls like better user warnings or clinical decision support.
When P1 and P2 Approach Works Best
This approach is particularly useful for:
- Combination devices
- Devices that deliver drugs
- Complex systems where technical and clinical risks are distinct
- Products requiring both engineering and clinical expertise
The nested risk models feature in the SoftComply Risk Manager Plus makes this implementation straightforward, maintaining full traceability between risks, controls, and verification activities.
Ready to try P1 and P2 hazard analysis? 👉 Try SoftComply Risk Manager Plus free for a month
Want to see it in action first? 👉 Book a live demo
The P1 and P2 approach isn’t magic, but when you need that extra precision in separating technical and clinical risks, it’s a solid tool to have in your risk management toolkit.


