

Risk reporting isn’t just another checkbox on your compliance list. It’s the backbone of effective risk management that keeps your team informed, your management happy, and your auditors satisfied. When you’re managing risks in Jira, you need clear, current reports that don’t require endless manual updates or screenshot juggling.
Watch this video to see exactly how to build risk reports in Jira dashboards and Confluence pages using the SoftComply Risk Manager apps.
In this video, I’m introducing three ways to generate risk reports:
- Jira dashboards with specialized gadgets,
- CSV/PDF exports,
- and (my favorite) live Confluence integration.
Reporting risks in Jira dashboards and on Confluence pages eliminates the copy-paste nightmare while keeping everything automatically updated.
Risk Reporting in Jira Dashboards
Creating risk reports in Jira dashboards starts with adding the right gadgets. When you have the SoftComply Risk Manager or Risk Manager Plus app installed, you get access to two key gadgets: Risk Matrix and Risk Table gadgets.
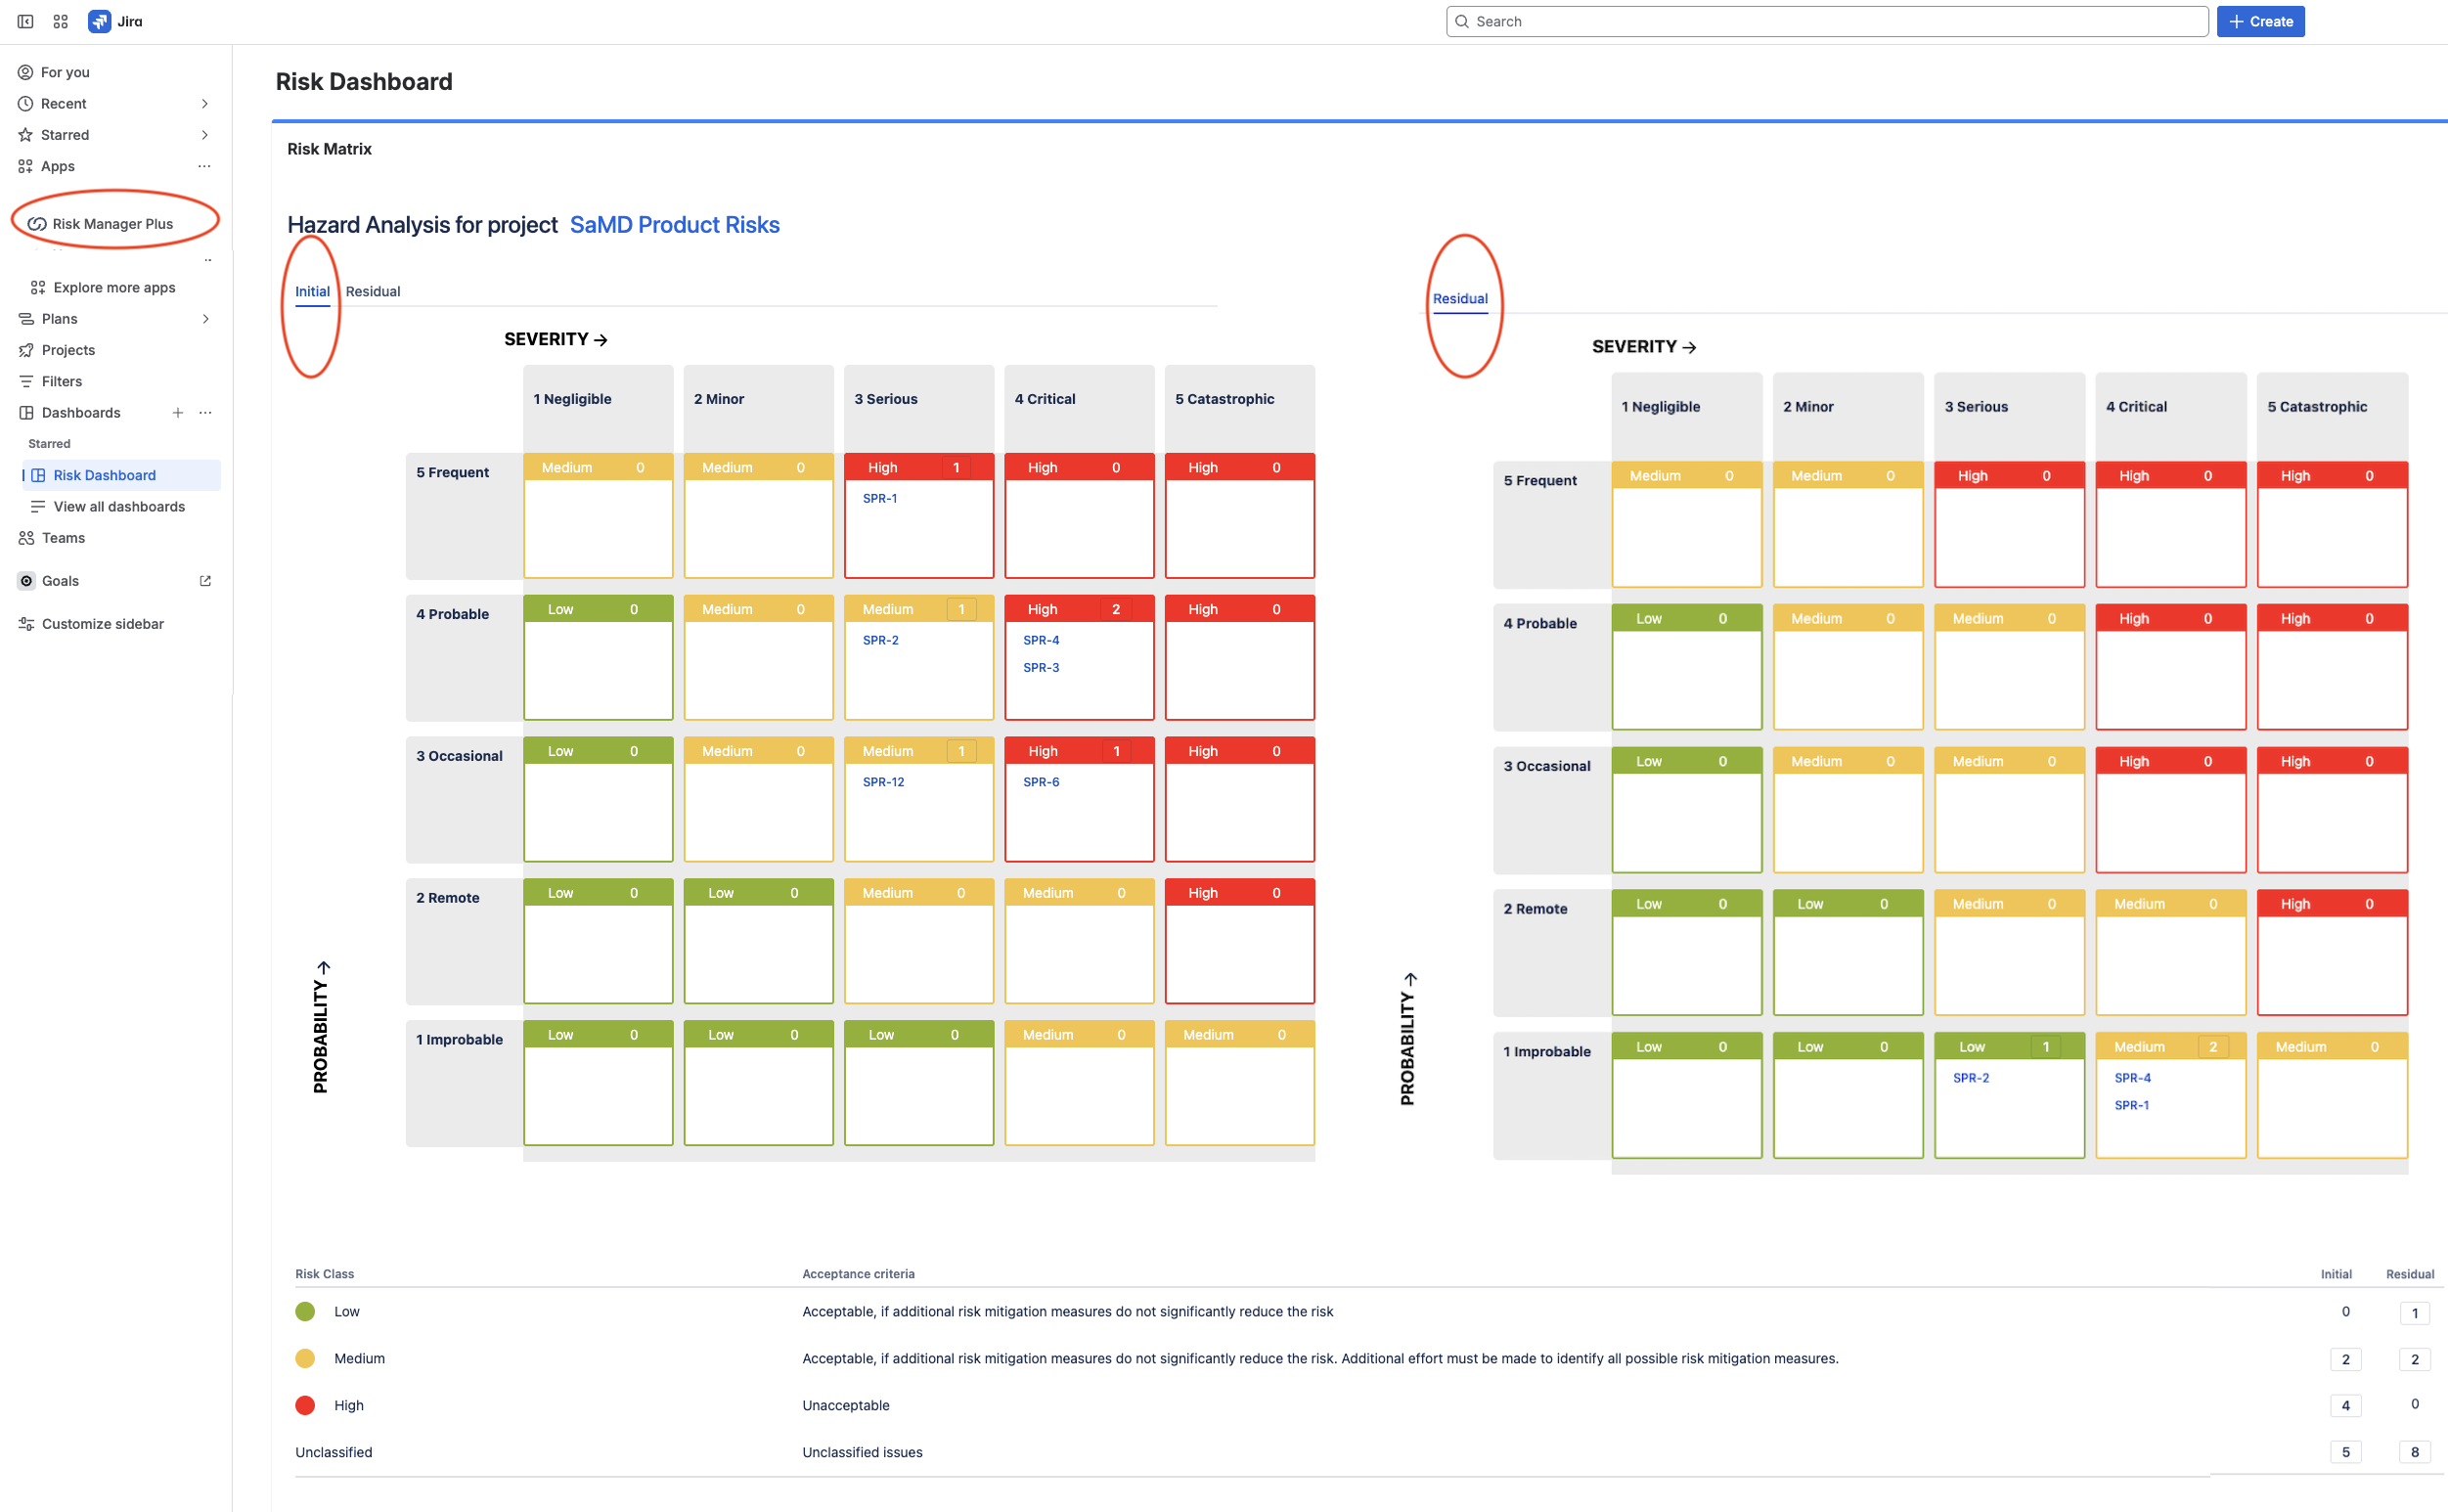
Risk Matrix in Jira Dashboard
To build your first risk matrix report, click “Add gadgets” and search for “risk.” Select the Risk Matrix gadget and choose your risk project – this tells Jira which project to pull your risk data from.
The configuration options let you customize what information appears on your matrix. You can display risk counts, Jira issue keys, detailed description for risk class and risk parameters, and risk acceptability criteria. This flexibility means you can create both summary views for executives and detailed reports for your risk team.
Risk Matrix Configuration Options:
- Risk counts per class
- Jira issue keys for traceability
- Risk class descriptions and acceptability criteria
- Detailed descriptions for each risk parameter
- Risk model and risk iteration (multiple models and iterations supported per Jira project)
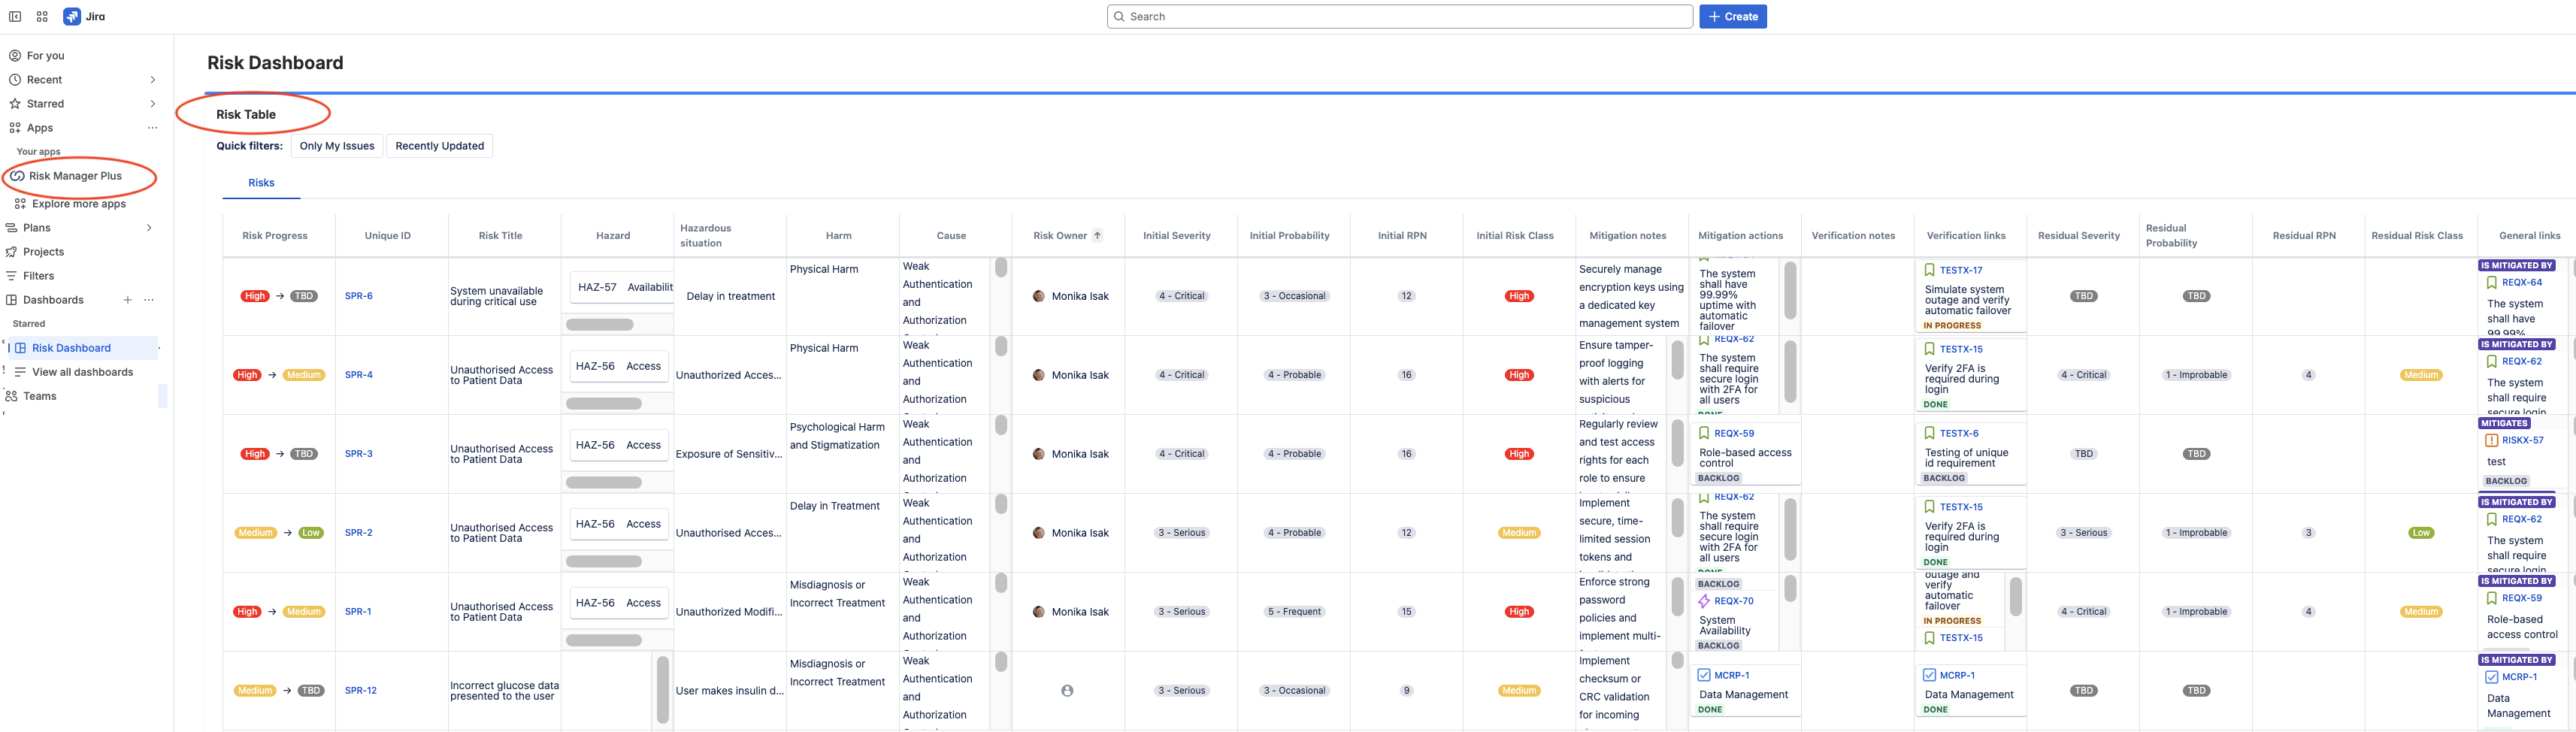
Risk Register in Jira Dashboard
The Risk Table gadget works similarly. After selecting your project, choose which sheet you want to display (Risk Manager Plus supports multiple sheets, just like Excel). The resulting table looks identical to your risk register in Jira, complete with initial and residual risk assessments.
Both gadgets update automatically when you modify risks in Jira. No manual refresh needed—your dashboard always reflects current risk status.
Risk Reports in Confluence
Confluence integration takes risk reporting to another level. The SoftComply Risk Manager for Confluence app provides three macros for embedding live risk data directly into your Confluence pages:
- Risk Matrix Macro: Displays risk matrices with full customization
- Risk Table Macro: Shows complete risk registers
- Risk History Macro: Tracks risk changes over time
Adding these macros is straightforward. Type “/” on any Confluence page, then “risk” to see available options. Each macro connects to your Jira projects and pulls current data automatically.
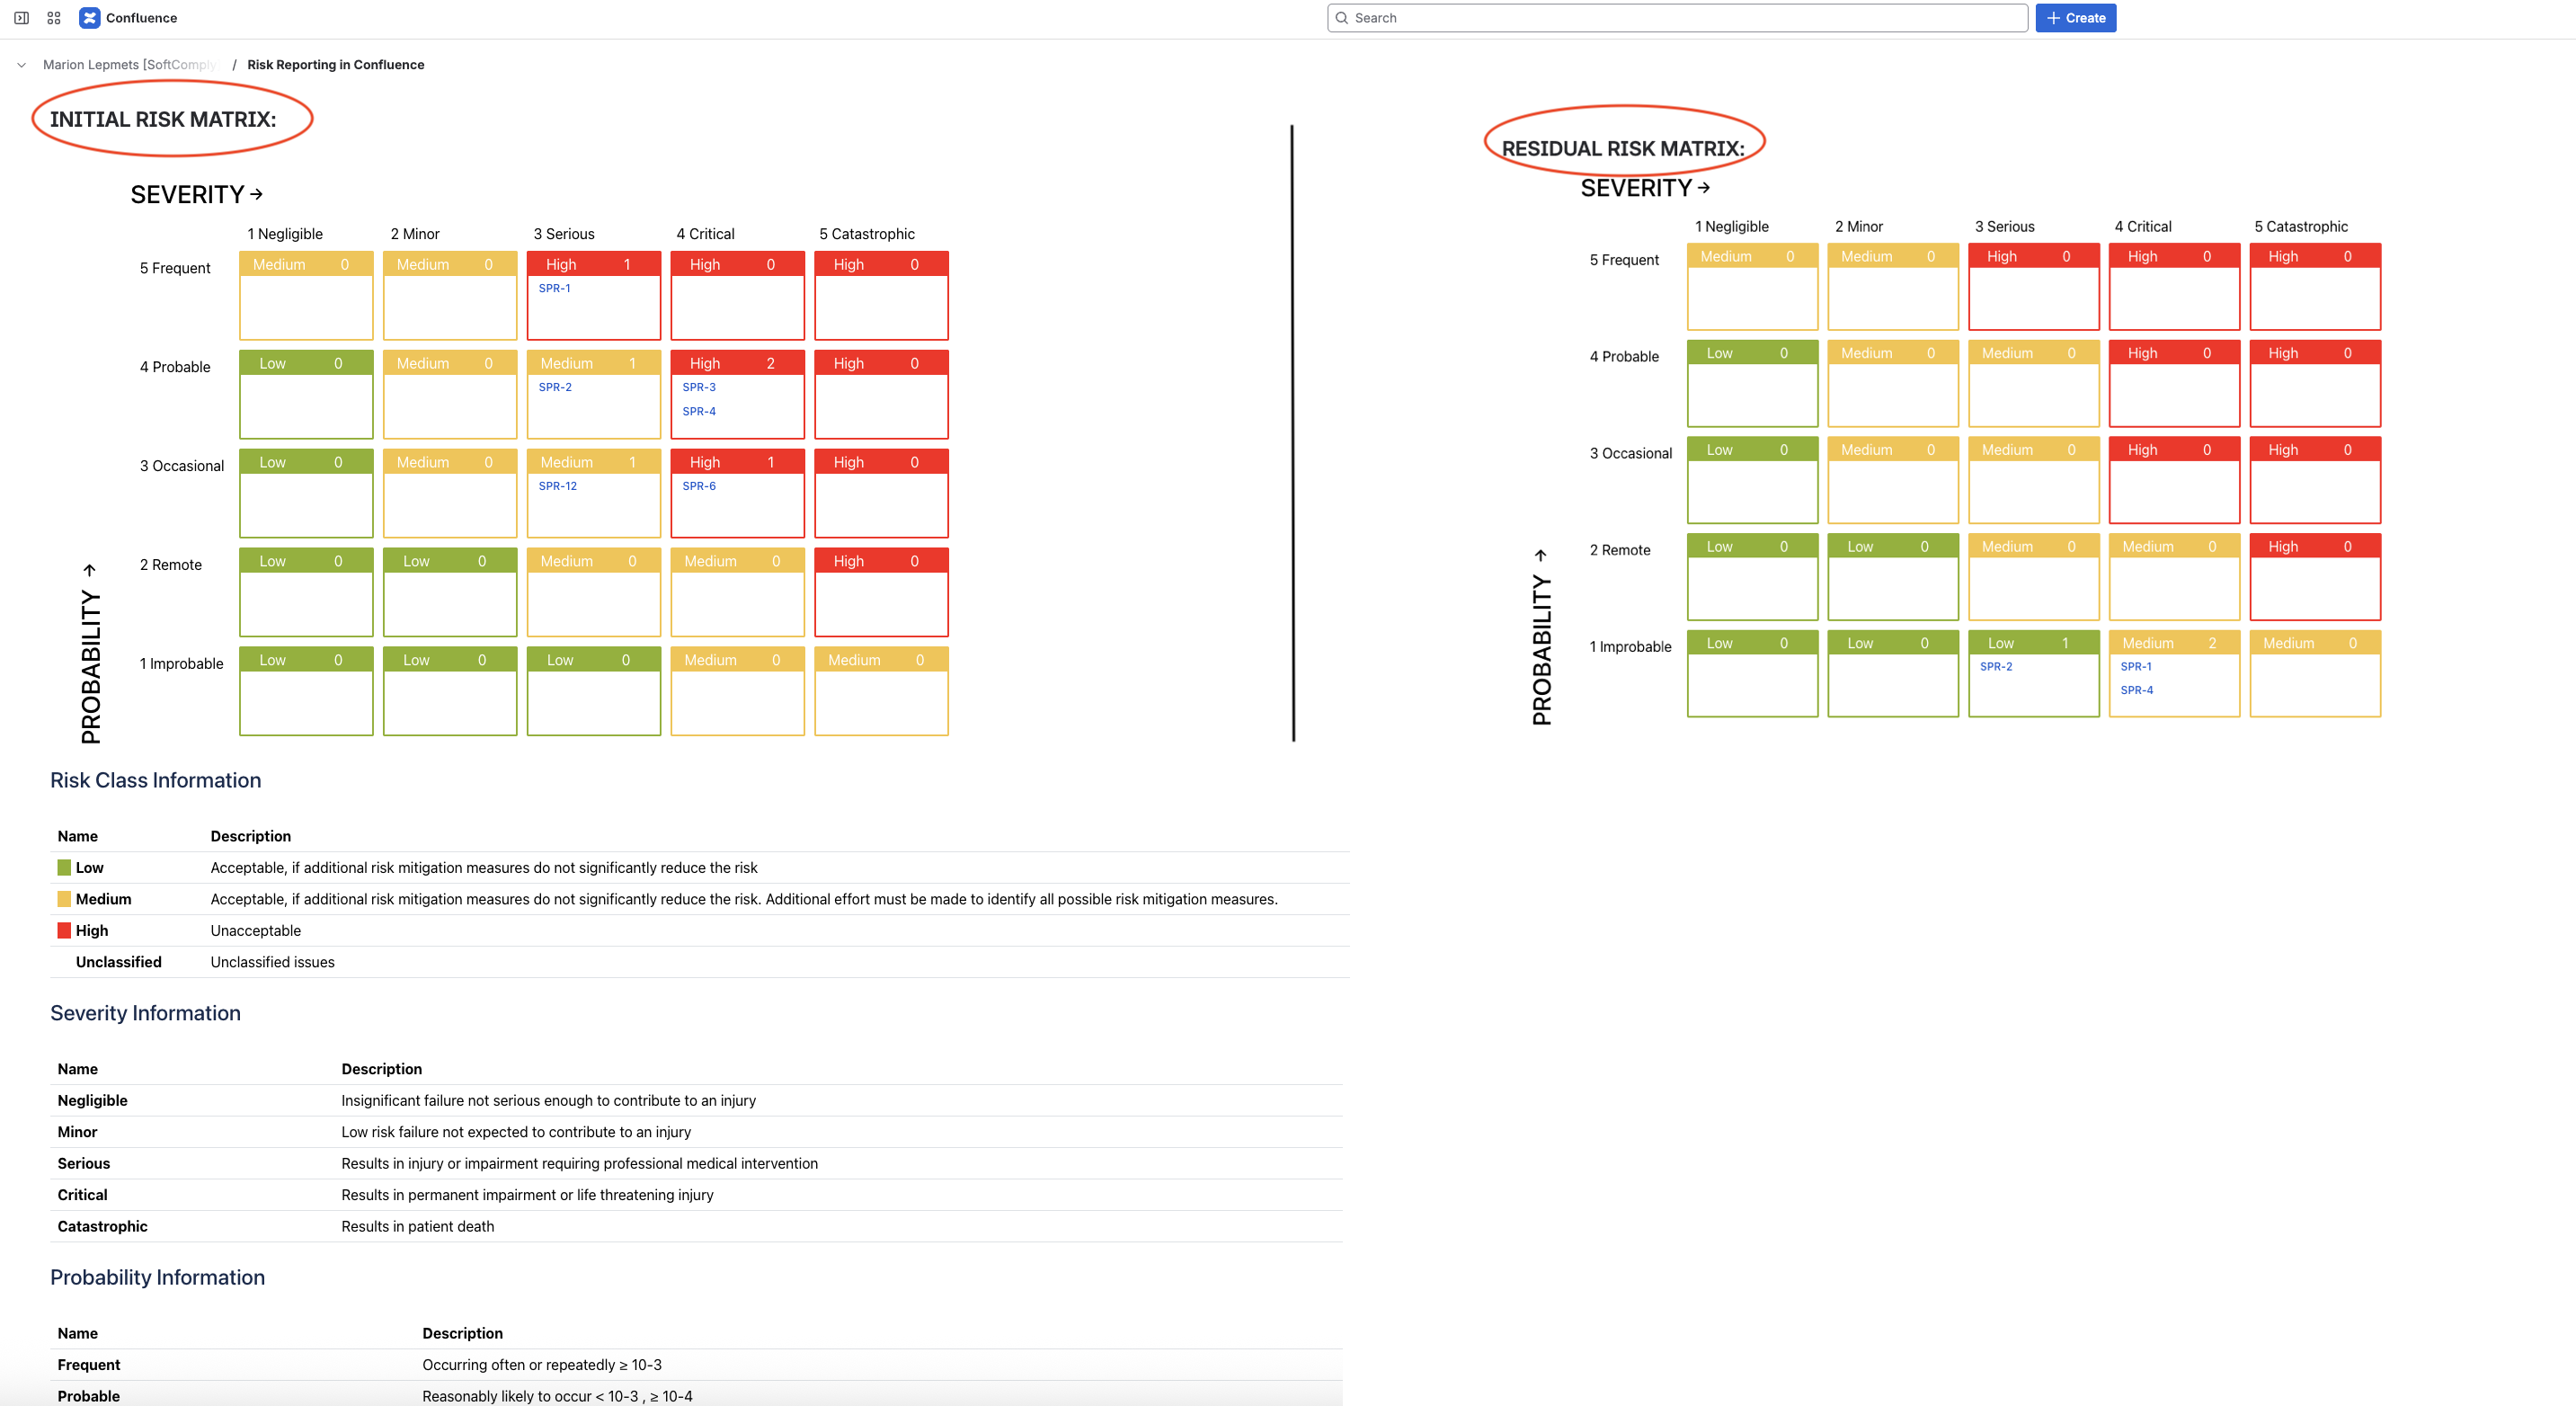
Risk Matrix in Confluence
The Risk Matrix macro lets you display both initial and residual risk assessments side by side. This comparison shows how your mitigation efforts have reduced risk exposure – critical information for stakeholder reports and audit preparation.
Configuration mirrors the Jira dashboard setup. Select your project, choose your risk model, and decide whether to show initial or residual risk assessment. You can include issue keys for traceability and risk class descriptions for context.
The visual output clearly shows risk distribution across your matrix. In my example, the initial assessment showed three critical risks and one serious risk. The residual matrix revealed successful mitigation—all high risks were reduced to acceptable levels.
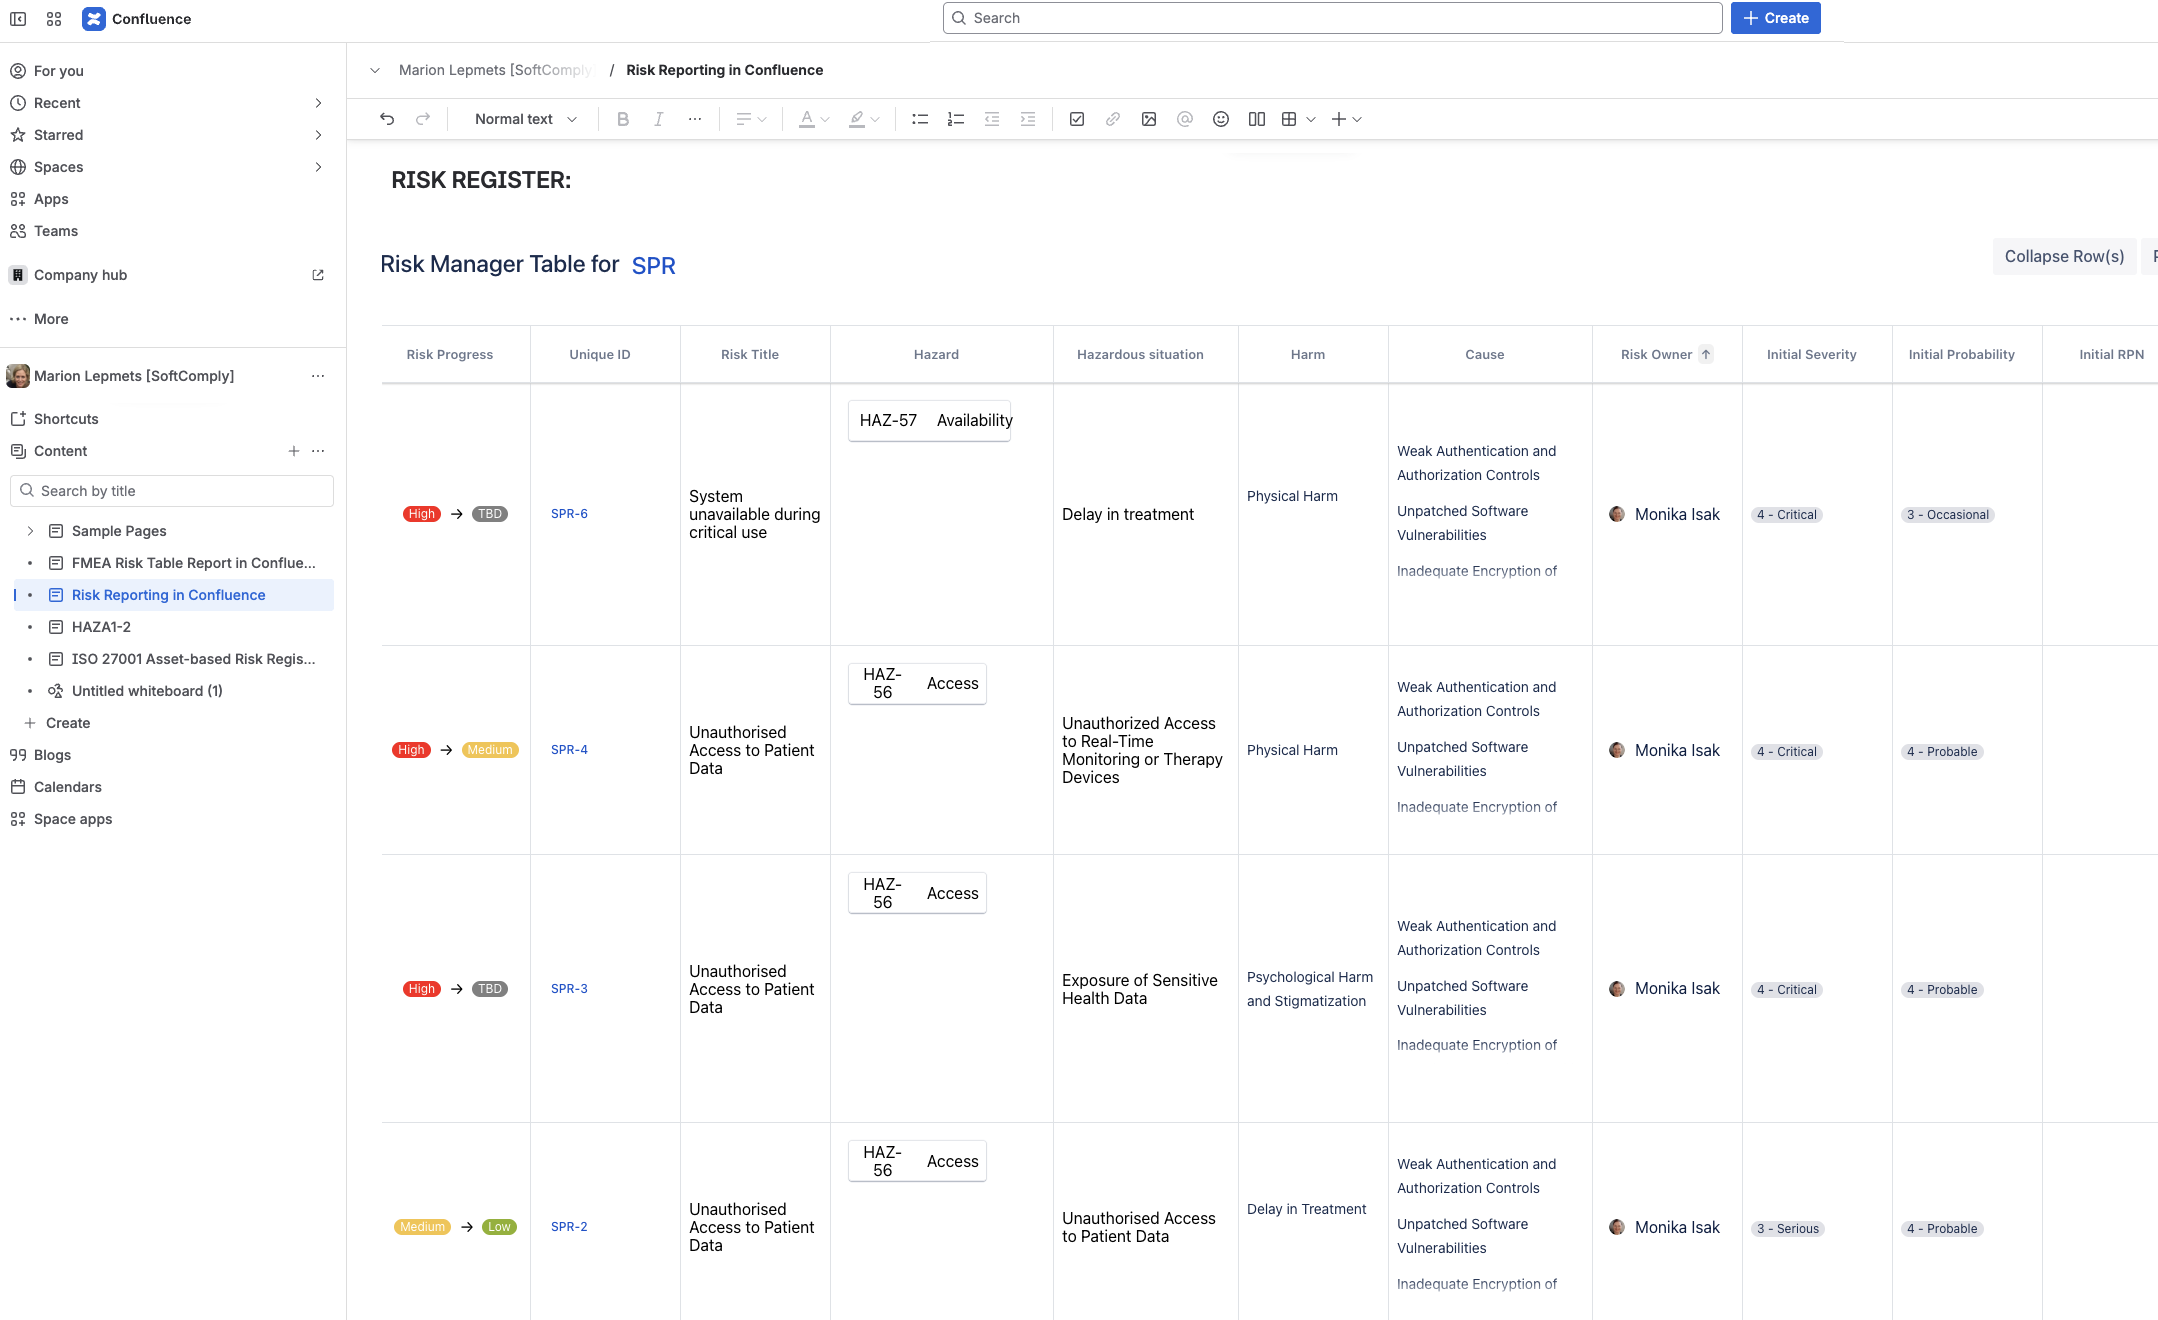
Risk Register in Confluence
The Risk Table macro brings your entire risk register into Confluence. It displays the same columns and data you see in Jira, including all risk assessment details and mitigation measures.
Since Risk Manager Plus supports multiple sheets per project (like Excel workbooks), you can choose which specific risk analysis to display. Whether it’s hazard analysis, FMEA, or another risk table tab, the macro pulls the exact data you need.
Clicking any risk in the table takes you directly to the corresponding Jira issue. This seamless navigation maintains workflow efficiency while providing stakeholders with comprehensive risk information.
Risk History in Confluence
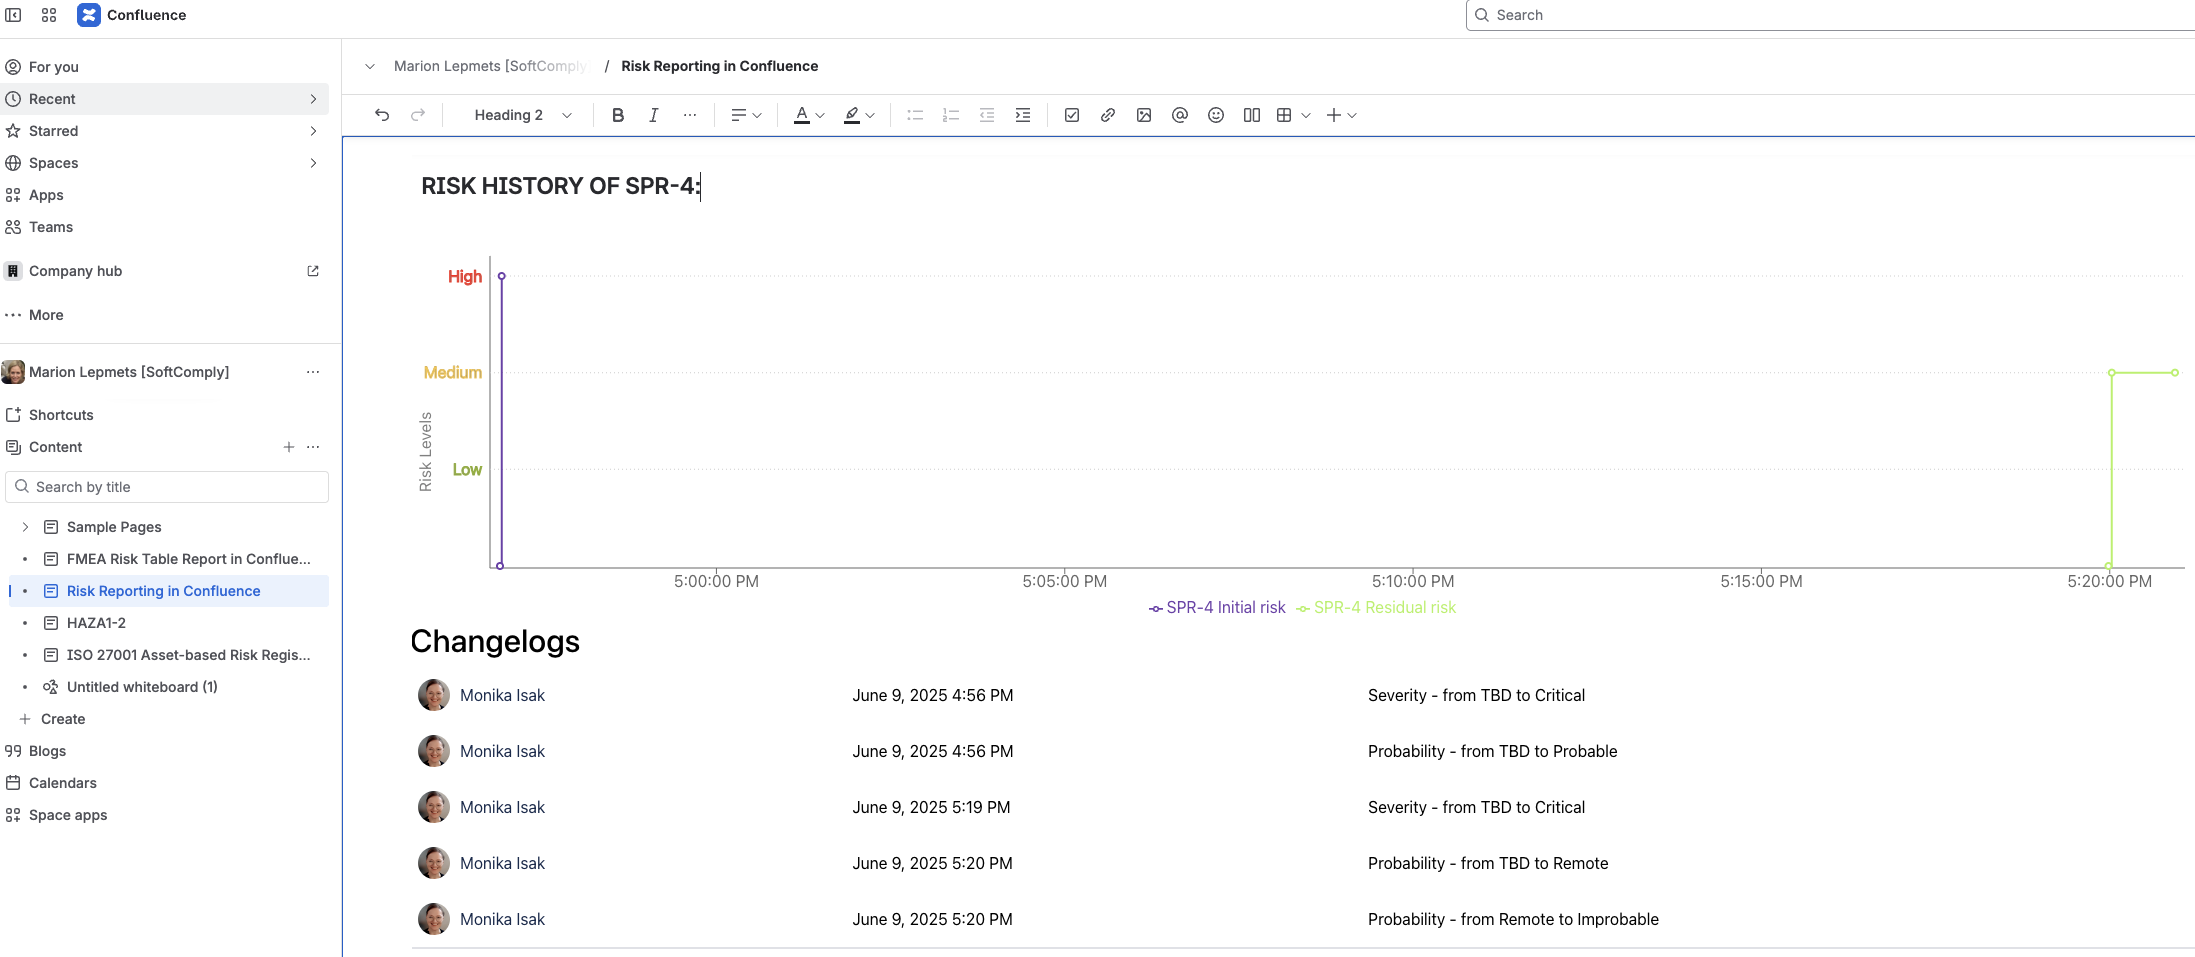
The Risk History macro creates visual timelines showing how individual risks have changed. This continuous monitoring capability is essential for understanding risk trends and mitigation effectiveness.
The graph displays up to five risks simultaneously (more becomes unreadable). Different coloured lines represent initial and residual risk assessments, making it easy to see mitigation progress over time.
Risk History Features:
- Visual timeline of risk changes
- Initial vs. residual risk tracking
- Customizable time frames
- Data table with detailed change history
- User attribution for all modifications
The optional data table underneath the graph provides granular details about who changed what and when. This audit trail is invaluable for compliance documentation and understanding risk evolution.
Multiple Risk Models per Project
One powerful feature across all reporting options is support for multiple risk models per project. Large organizations often need different risk frameworks for various processes – hazard analysis for product development, operational risk for business processes, or compliance risk for regulatory requirements.
Risk Manager Plus lets you assign multiple models to each Jira project. When generating reports, you simply select which model’s data to display. This flexibility eliminates the need for separate projects while maintaining clear separation between different risk types.
Real-Time Updates Eliminate Manual Report Maintenance
The biggest advantage of this approach is automatic synchronization. Every change in Jira immediately reflects in your Confluence pages and Jira dashboards. No more outdated screenshots, stale spreadsheets, or manual report updates.
This real-time connection supports evidence-based decision making by ensuring stakeholders always see current risk status. Management presentations, audit documentation, and team reviews all work from the same live data source.
Implementation Requires Both Jira and Confluence Apps
To use these reporting features, you need the SoftComply Risk Manager Plus app in Jira and the free extension for risk reporting: SoftComply Risk Manager for Confluence. The apps work together to provide seamless data integration between platforms.
The setup process is straightforward – install the apps, configure your risk projects in Jira, then add the appropriate macros or gadgets where you need reports. The connection happens automatically once both apps are active.
👉 Try SoftComply Risk Manager Plus free for a month
👉 Book a live demo
Risk reporting doesn’t have to involve spreadsheet wrestling or screenshot hunting. With the integration between Jira and Confluence, you can create professional reports that update themselves while maintaining the detailed traceability your auditors demand.
Check out SoftComply products for risk management to see how these tools can streamline your entire risk management process, from initial assessment through final reporting.


